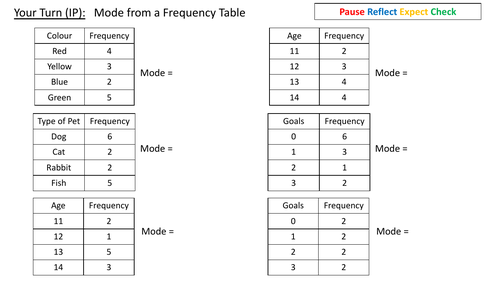
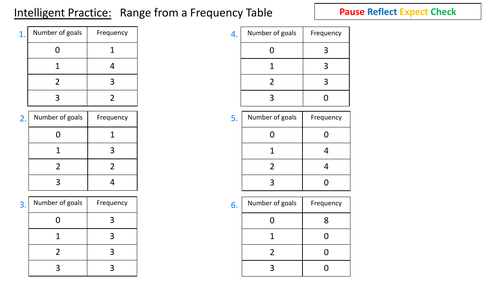
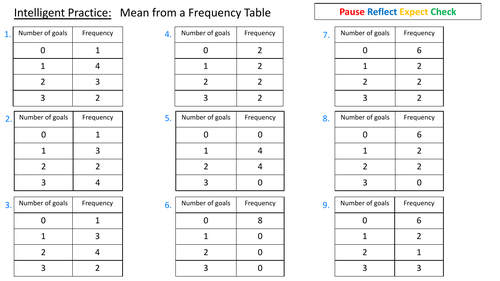
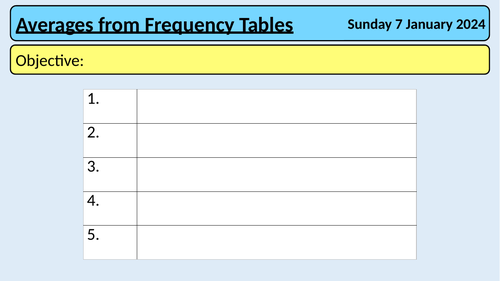
Calculate averages (mode, median, mean) and range from frequency tables.
PowerPoint includes fully animated examples, pictorial representations when applicable. Split screen with Teacher example and Pupil’s turn followed by questions with animated answers. Questions use intelligent practice to allow pupils to see links and build a deeper understanding of the topic.
Worksheets to be able to be printed for pupils to use and work on.
Creative Commons "Sharealike"
Reviews
5
Select overall rating
(no rating)
Your rating is required to reflect your happiness.
Must have taken a lot of determination to make finding the median so clear!
MerseyMaths
4 months ago
Thank you, best way to get my lower sets to understand why we teach it this way. Please email merseymaths364@gmail.com get a resources for free of your choice.
Empty reply does not make any sense for the end user