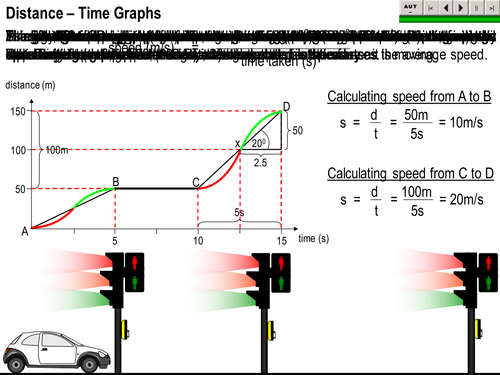

A Distance - Time graph lesson with animated sequences that demonstrates the difference between average and instantaneous speeds. During animations a bar appears under the navigation buttons that wipes across until the animation has finished; it can be paused. For the buttons to work, the macro security level has to be set to medium. This is very easy and only needs to be done once; it will not compromise your computer. Select <Tools> then <Macro> then <Security> select<Medium>. This is for ver. 2002; it might be different for later versions. COMMENTS WILL BE MUCH APPRECIATED
Something went wrong, please try again later.
Fantastic resource; Very clear demonstration and examples.
Great PPT.
I really like the animation!
This was a truly excellent resource. It is very clear, excellent graphics and animations. Thank you.
Report this resourceto let us know if it violates our terms and conditions.
Our customer service team will review your report and will be in touch.
£0.00