Interpolation and Extrapolation Graphing Worksheet with Data Interpretation
Help students build confidence with interpolation, extrapolation, and graph interpretation through this structured lesson and worksheet. Designed for secondary math and science learners, the resource guides students in plotting data, drawing best-fit lines, and using graphs to make predictions both within and beyond the given data range.
Ideal for data analysis and problem-solving lessons, it supports students in understanding how graphs communicate information and how predictions should be made carefully and logically.
What This Resource Includes
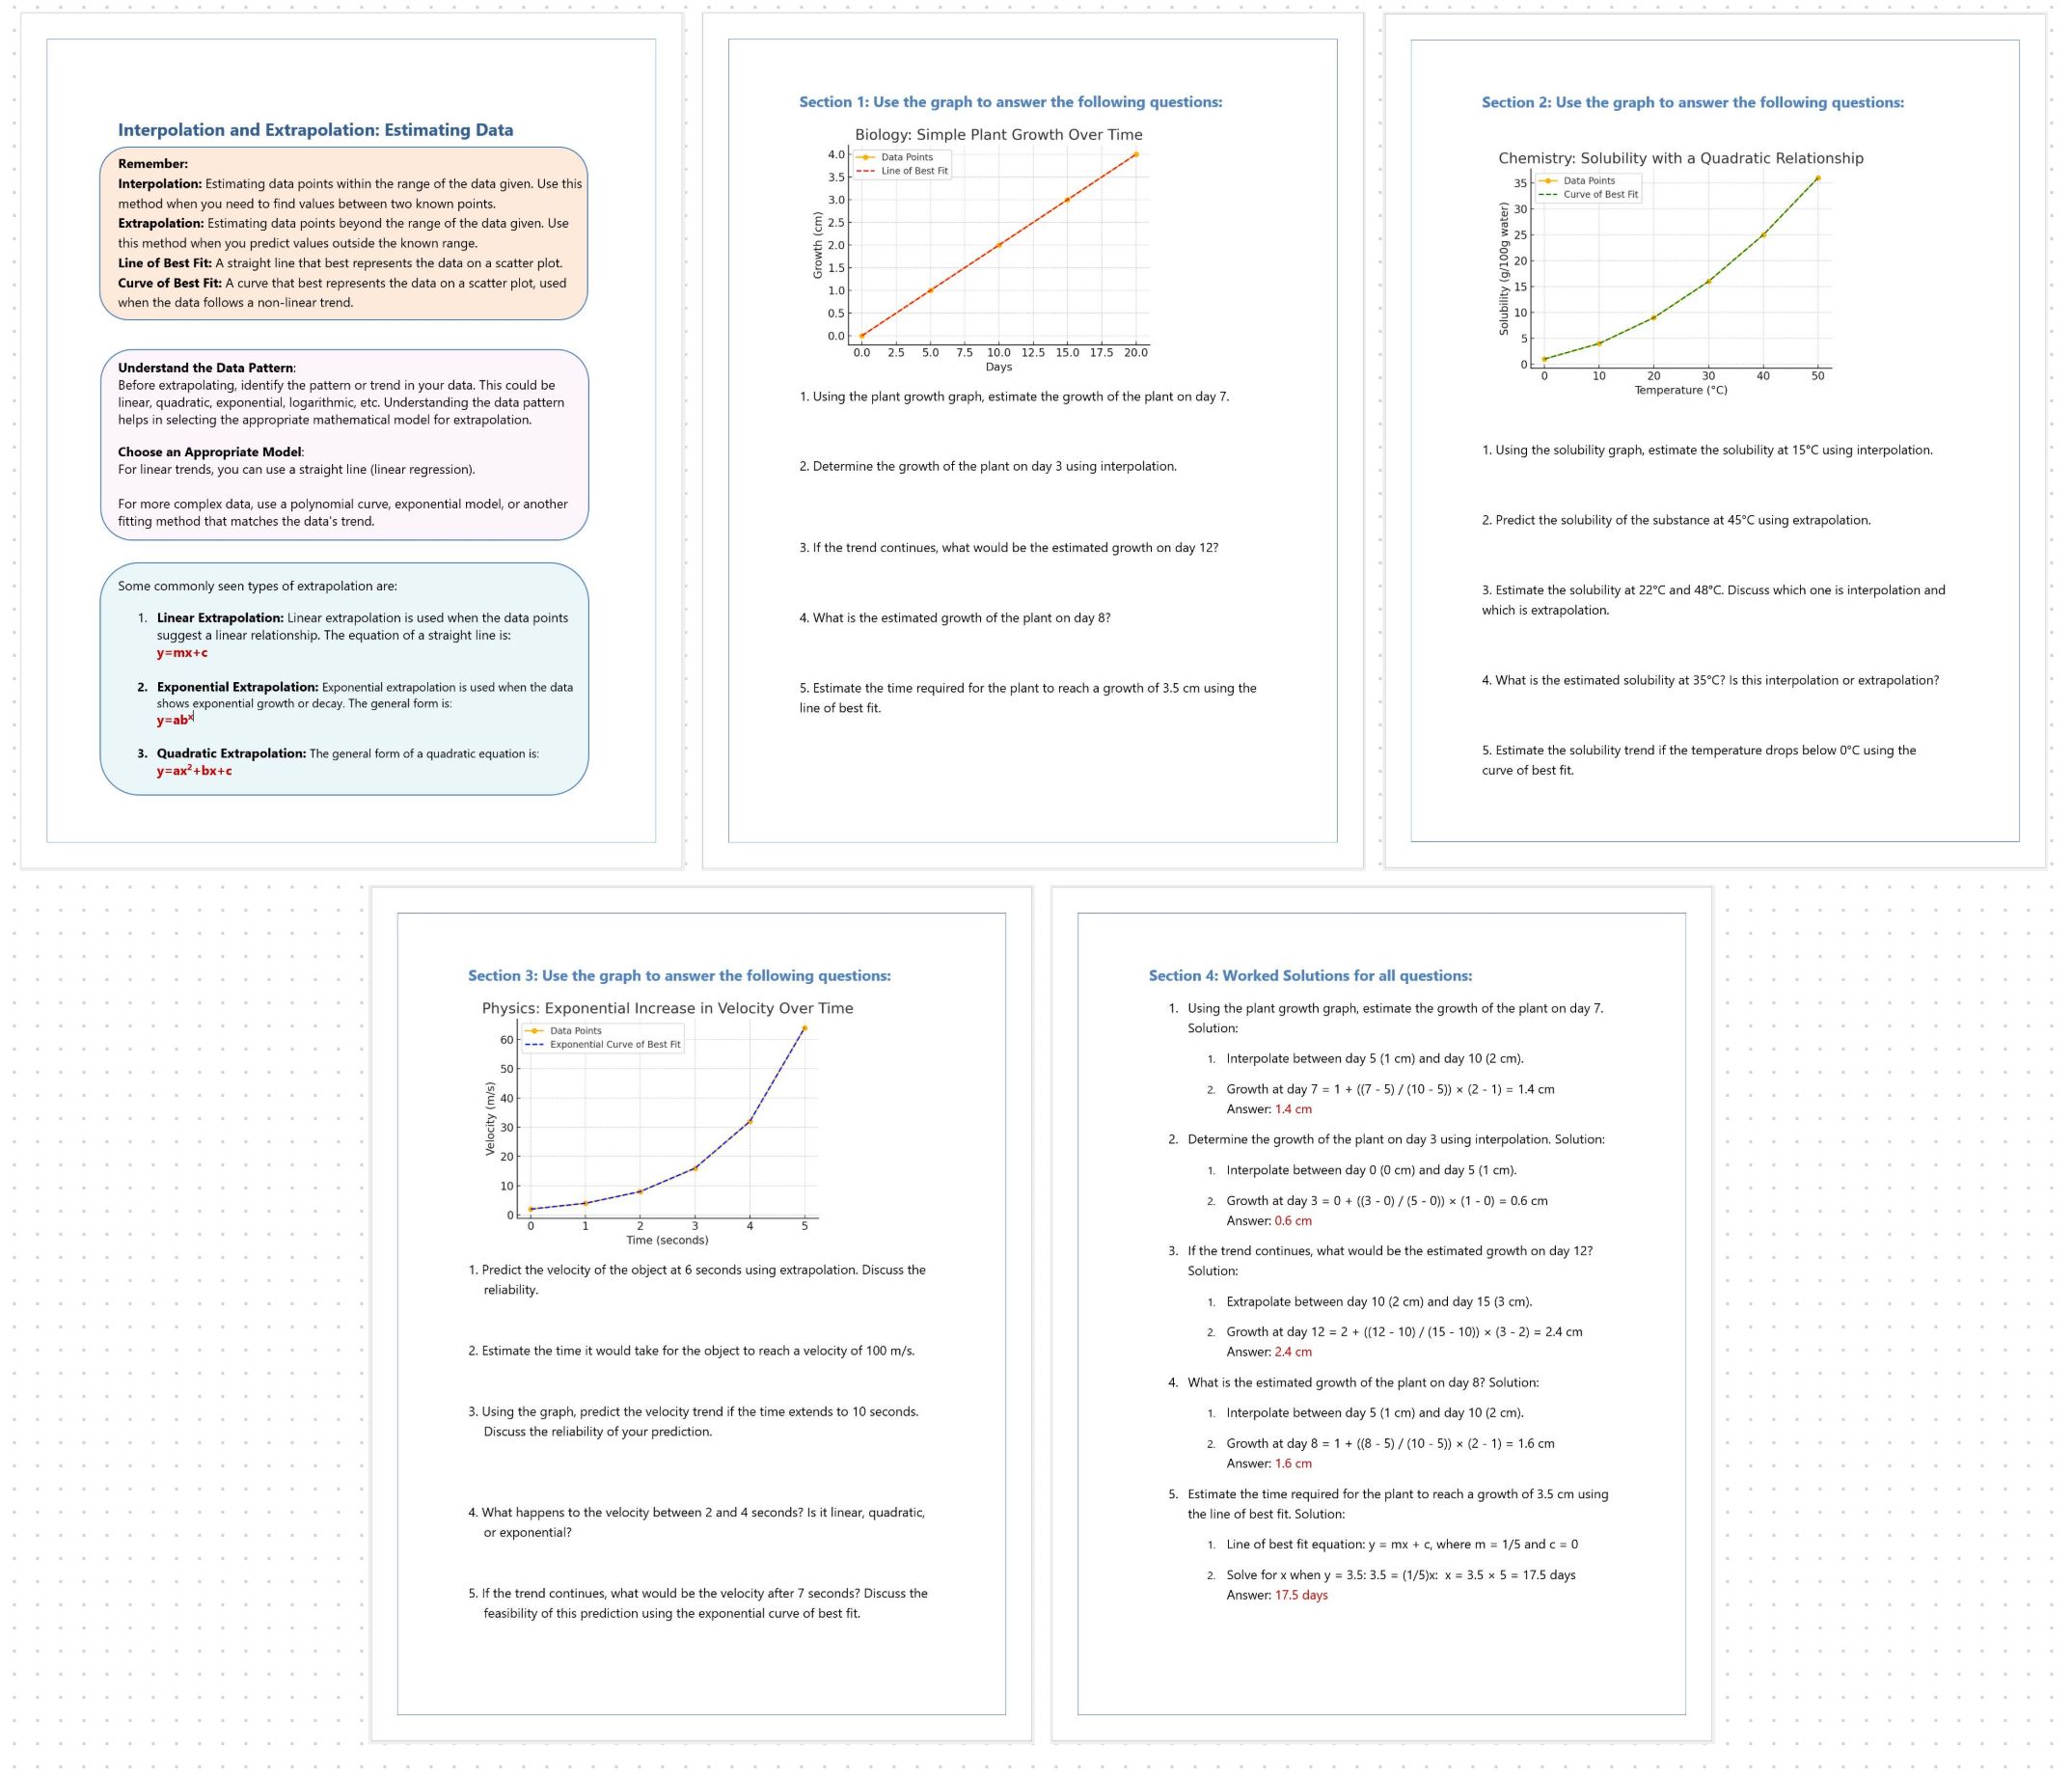
• Clear explanations of interpolation and extrapolation
• Guided graphing tasks using realistic datasets
• Practice questions requiring predictions from graphs
• Interpretation tasks linking graphs to real contexts
• Podcast-style audio summary reinforcing key ideas
• Print and digital-friendly worksheet format
Learning Focus
Interpolation vs Extrapolation
Students learn the difference between estimating values inside the data range and predicting beyond it, including why extrapolated values may be less reliable.
Graphing Data
Learners practise plotting points accurately, selecting appropriate scales, and drawing suitable lines or curves of best fit.
Prediction and Interpretation
Students use graphs to estimate values and explain the reasoning behind their answers, strengthening mathematical communication skills.
Real-World Application
Scenario-based questions connect graphing skills to contexts such as scientific measurements, environmental trends, or motion data.
Audio Learning Support
A short podcast-style audio summary accompanies the worksheet, providing an engaging overview of the key concepts. This supports auditory learners and reinforces understanding outside of class.
Skills Developed
Plotting and scaling graphs
Using best-fit lines
Making and justifying predictions
Interpreting trends
Explaining reasoning clearly
Ideal For
Secondary mathematics classes
Science data-analysis lessons
Statistics units
Independent or group practice
Revision or formative assessment
This resource makes graphical prediction skills accessible and engaging, helping students interpret data with greater confidence and accuracy across STEM subjects.
Get this resource as part of a bundle and save up to 10%
A bundle is a package of resources grouped together to teach a particular topic, or a series of lessons, in one place.
Bundle
IB DP Science IA Bundle Part 2 of 2 Start to Finish Internal Assessment Resources 2026
This comprehensive 2-part bundle supports teachers and students through every stage of the IB Diploma Programme Science Internal Assessment (IA) — from choosing a topic to submitting a polished, high-quality report. Designed for Biology, Chemistry, and Physics, the bundle combines idea banks, planning tools, writing guides, assessment checklists, marking rubrics, moderation aids, timelines, and data-analysis support to make the IA process clearer, more structured, and more successful for learners at every level. This resource set is ideal for departments seeking a consistent IA system, teachers guiding students through the year, and students who need clear guidance, scaffolding, and practical tools to plan, conduct, and communicate their investigations. Please note: This is Part 2 of the complete bundle package. It contains 11 of the 23 resources available. The first 12 resources will be available in Part 1 of the bundle. Part 1 Can be found here: [https://www.tes.com/teaching-resource/ib-dp-science-ia-bundle-part-1-of-2-start-to-finish-internal-assessment-resources-2026-13404159](https://) What’s Included in This Complete Bundle Idea and Topic Banks • Extensive subject-specific IA idea databases for Biology, Chemistry, and Physics • Hundreds of investigation prompts to inspire research questions • Suggestions for experimental, database, simulation, survey, and hybrid investigations Planning and Proposal Tools • Structured IA planning templates for research questions, variables, methodology, risk assessment, and data planning • Milestone timelines with automatic date calculations • Progress tracking to help students manage workflow across months Writing Guides and Worksheets • Conclusion writing support and frameworks • Evaluation writing lesson and templates • Worksheets for significant figures, uncertainty propagation, graph interpretation, regression (R²), and more • Student self-assessment checklists to confirm completeness before submission Assessment, Marking & Moderation Tools • Teacher marking rubric aligned with IB criteria • Standardized marking and moderation system with analytics dashboards • Double-marking support and variance tracking • Calibration records and moderation logs Why This Bundle Is Valuable Simplifies a Complex Process The IA is one of the most challenging components of IB Science. This bundle breaks it into manageable, clearly guided steps that students can follow with confidence. Supports Inquiry and Independence Open-ended idea banks paired with planning templates encourage authentic student-led investigations while reinforcing independent thinking and problem solving. Improves Quality and Readiness Tools that help students plan, write, check, and revise ensure investigations are well thought-out, fully developed, and aligned to assessment criteria. Reduces Teacher Workload Standardized rubrics, checklists, and progress trackers save time, support consistency, and free teachers to focus on feedback and conceptual development. Aligned With IB Expectations Every component supports IB academic integrity, criterion understanding, and best practices for assessment design, execution, and communication. Who This Bundle Is For • IB Science teachers guiding IA development • IB coordinators implementing department-wide IA systems • Students needing structured support from start to finish • Classes that benefit from milestone-based tracking and accountability • Learners preparing for laboratory work, analysis, writing, and reflection Whether your class is just beginning the IA journey or you’re refining submissions for moderation, this bundle provides everything needed to inspire topics, organise thinking, strengthen scientific communication, and deliver high-quality Internal Assessments with confidence.
£42.30
Bundle
Graphing, Trends, Correlation, Extrapolation Bundle with Audio Support 2026
**Graphing and Data Interpretation Skills Bundle Worksheets with Audio Summaries** This bundle brings together a set of structured worksheets designed to build confidence in graphing, data analysis, and statistical interpretation. Covering key skills such as interpreting graphs, identifying trends, understanding correlation, interpolation, extrapolation, and working with R², these resources help students make sense of data visually and mathematically. Suitable for secondary mathematics and science classrooms, the bundle supports learners in developing the analytical skills needed to interpret real data, explain relationships, and draw justified conclusions. **What This Bundle Includes** • Worksheets on interpreting graphs and identifying trends • Activities focused on correlation and data relationships • Lessons on interpolation and extrapolation • Graphical analysis tasks involving coefficient of determination (R²) • Realistic data scenarios for applied learning • Podcast-style audio summaries for each topic • Print and digital-friendly formats Learning Focus Graph Interpretation Students practise reading a variety of graph types and extracting meaningful information from visual data. Trend and Correlation Analysis Learners identify positive, negative, and no-correlation patterns, and describe the strength and direction of relationships. Prediction Skills Through interpolation and extrapolation tasks, students learn how to estimate values carefully and understand the reliability of predictions. Model Understanding R² activities introduce students to evaluating how well a model explains variation in data. Contextual Thinking Real-world scenarios encourage students to link graphs and statistics to scientific and everyday contexts. Audio Learning Support Each topic includes a short podcast-style audio summary that reinforces key concepts. This supports auditory learners and provides an easy way to revisit learning outside of class. Skills Developed Plotting and analysing graphs Identifying trends and relationships Understanding correlation and model fit Making and justifying predictions Explaining data in written form Ideal For Secondary maths and science lessons Data and statistics units Revision and consolidation activities Homework or independent practice Building cross-curricular data literacy This bundle helps students move beyond simply drawing graphs to understanding what the data shows and how to communicate it clearly. By combining structured worksheets with audio reinforcement, it supports different learning styles while strengthening core analytical skills across STEM subjects.
£10.80
Something went wrong, please try again later.
This resource hasn't been reviewed yet
To ensure quality for our reviews, only customers who have purchased this resource can review it
Report this resourceto let us know if it violates our terms and conditions.
Our customer service team will review your report and will be in touch.
£3.99