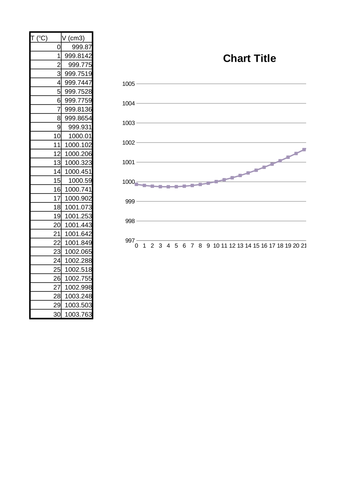


This lesson was based on an idea shared with me by Ron Lancaster at SEAMC 2015. It looks at the equation used to model the change in volume of 1kg of water as temperature changes. I like this task for the real life aspect and for the amount of maths hidden inside one idea.
See my website for a more detailed teachers note:
http://mrsmorganmaths.weebly.com/water-graph.html
@em0rgan
See my website for a more detailed teachers note:
http://mrsmorganmaths.weebly.com/water-graph.html
@em0rgan
Something went wrong, please try again later.
This resource hasn't been reviewed yet
To ensure quality for our reviews, only customers who have downloaded this resource can review it
Report this resourceto let us know if it violates our terms and conditions.
Our customer service team will review your report and will be in touch.
£0.00
