

Distance-Time Graphs
Key Stage: 3 ★★★
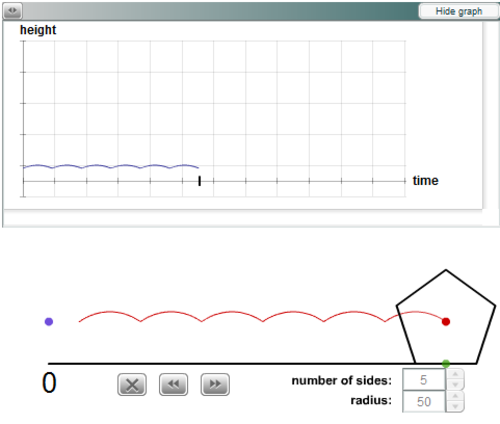
A regular polygon rolls along, and the graph plots the distance travelled by the dot or its height.How do the location of the dot and the number of sides affect the graphs?
The problem provides a visual context in which to consider how graphs can represent horizontal and vertical movement over time.
This resource has comprehensive teachers' notes and resources, linked from the problem page. This includes possible approaches and key questions, as well as possible support and extensions.
The file attached is a HTML file, which, when opened, automatically redirects you to the problem on the NRICH website.
Key Stage: 3 ★★★
A regular polygon rolls along, and the graph plots the distance travelled by the dot or its height.How do the location of the dot and the number of sides affect the graphs?
The problem provides a visual context in which to consider how graphs can represent horizontal and vertical movement over time.
This resource has comprehensive teachers' notes and resources, linked from the problem page. This includes possible approaches and key questions, as well as possible support and extensions.
The file attached is a HTML file, which, when opened, automatically redirects you to the problem on the NRICH website.
Something went wrong, please try again later.
Nice task on Loci. Pupils can visualise and try to predict the path that the red dot will follow when different polygons are 'rolled' - you can change the number of sides and the size of the polygon.
Report this resourceto let us know if it violates our terms and conditions.
Our customer service team will review your report and will be in touch.
£0.00