
Used in the whole class setting, students' intuitions about what is likely to be an outlier
can be offered up through a range of different problems. This is a really simple but fun spreadsheet
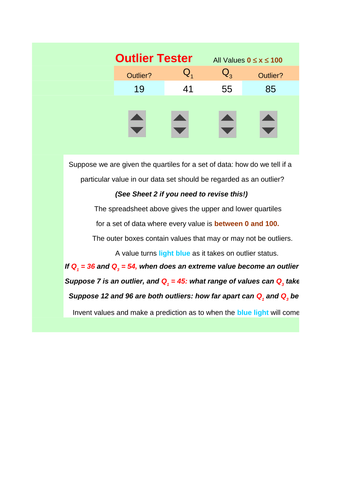
that gives students a chance to explore the definition of an outlier that uses the IQR.
If we are given the quartiles for the data, then a rough rule of thumb is: anything less than Q1 – 1.5(IQR) can be regarded as an outlier. anything greater than Q3 + 1.5(IQR) can be regarded as an outlier.
Something went wrong, please try again later.
A nice resource looking at outliers and how changing the upper and lower quartile affects the outliers in a set of data. Could be used as an introduction to the topic or used as an activity within a lesson on box plots/IQR. I like this as it could also be used to start class discussions about outliers.
Report this resourceto let us know if it violates our terms and conditions.
Our customer service team will review your report and will be in touch.
£0.00