

This resource is for KS3 students who have studied pictograms, bar charts and pie charts. While labeled as an ‘activity’, it will cover most of a lesson. There are two parts to the resource - the handout to be given to the students and the presentation that covers the activity.
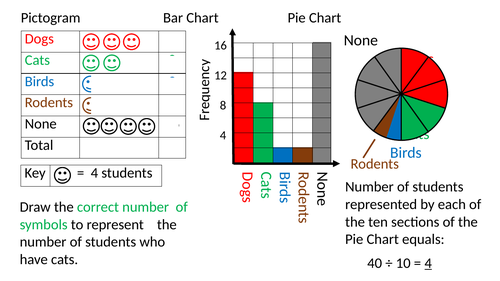
The presentation includes an introduction that shows how pictograms, bar charts and pie charts are connected and also shows students how to compare two of the same sort of chart. Students than have to match 12 pictograms to 12 bar charts and 12 pie charts. One of each is missing and students have to draw the missing charts. Other charts are incomplete and students have to complete them.
Something went wrong, please try again later.
Thanks for sharing this resource.
Report this resourceto let us know if it violates our terms and conditions.
Our customer service team will review your report and will be in touch.
£0.00