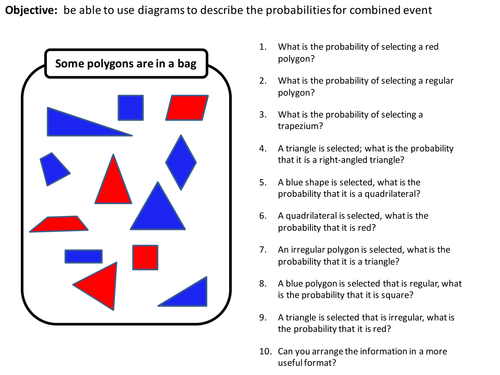
The brief: "Probability: using diagrams for combined event including Venn diagrams and two way tables".
Accordingly, this was possibly created in reaction to a "typo" in a challenge that was set; possibly created in reaction to an ongoing clash between the jargon of mathematics and Crystal-mark plain English; possibly not.
This resource looks (constructively and positively!) at how one could find an event (singular) which features combined probabilities (think combined=compatible and hence of withdrawing, say, Queen of Diamonds from a pack of cards). This resource then moves into more traditional territory: combined independent events (plural!): each event with its own set of distinct mutually-exclusive outcomes.
The resource encourages pupils to think about how to arrange data from these events and it can be used to lead them towards either (somewhat complex / technically flawed?) Venn diagrams or (more traditional and clear!) two-way tables [albeit a "sample space" would be preferable to both] as a means to clarify and present the raw data for speedy analysis.
The language and symbols of set theory are used in places and may need decoding for pupils. The absence of a true sample space may render these slides "unsatisfying" for mathematicians likely to progress to the highest grades and on to A-Level; however, the faith was kept with the brief; next time... ;-)
Something went wrong, please try again later.
Great ideas to support some of the new probability concepts...the later part of the powerpoint is very complex/complicated though....
Report this resourceto let us know if it violates our terms and conditions.
Our customer service team will review your report and will be in touch.
£0.00
