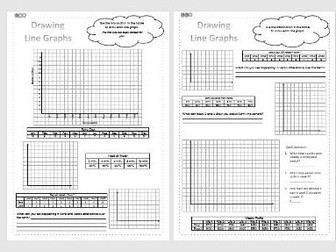
This set of worksheets is intended for practice in drawing line graphs based on data given in tables. They follow on from lesson 4 in a lesson sequence available on TES. Some interpretation questions are also included.
Differentiated:
3 dots = higher ability, 2 dots = middle ability, 1 dot = lower ability
Download the 4 lesson sequence these worksheets correspond with via the link:
https://www.tes.com/teaching-resource/data-4-lesson-smart-notebook-slides-tables-two-way-tables-line-graphs-ks2-11995417?theme=4
For other worksheets from this series, follow these links:
Simple Tables - https://www.tes.com/teaching-resource/simple-data-table-differentiated-worksheets-ks2-statistics-11995451
Two-way Tables - https://www.tes.com/teaching-resource/two-way-tables-differentiated-worksheets-data-statistics-ks2-11995458
Interpreting Line Graphs - https://www.tes.com/teaching-resource/interpreting-line-graphs-differentiated-worksheets-ks2-11995467
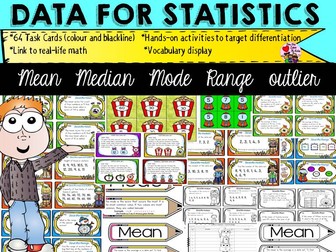
Facilitate sound conceptual knowledge of data for statistics (mean, median, mode, range, and outlier) with this student-friendly resource. The 64 task cards (colour and blackline) and hands-on activities not only target differentiation in the classroom but also provide a vital link to real-life math.
WHAT IS INCLUDED
20 Task Cards on finding the Range of a data set. Task cards range in complexity. Cards 1-12 facilitate acquisition of key concepts through visuals and simpler tasks. Cards 13-20 are more challenging. 20 task cards on finding the mode, median, and outlier. Cards 1-14 facilitate acquisition of key concepts. Cards 15-20 are more challenging.
24 task cards on finding the Mean. Task cards range in complexity. Cards 1-8 facilitate acquisition of key concept. Cards 9-24 are more challenging.
* All task cards feature kid friendly font and eye-catching graphics that make conceptual content less daunting.
WHAT ELSE
* 4 hands-on activities targeting students who are academically challenged. Students cut apart the data cards, arrange in ascending order and find the median, mode, mean, range and outlier. They record their findings in their maths journals. Data cards feature gumballs, apples, popcorn, and candy bags.
*4 task cards that provide a connection to real-life math. These tasks are fun and students use their maths journal to record answers. The task cards feature the following activities: What’s in a name? It’s the age! Real-life maths with Dice Numbers Real-life maths with Telephone Numbers Math vocabulary display cards that feature the word and definition of mean, median, mode, range, and outlier.
*Response Sheets to record results. Answer keys.
SUGGESTED USE Use the colour task cards in centres. The blackline task cards may be glued in students’ math journals for reference. There are 4 cards on a page. You also have the option to print all 20/24 cards on a single page that students can attach to their journals for reference. You can also play Scoot with the task cards or simply leave them around the classroom for students to move quietly and solve.
A short activity which demonstrates the importance of correctly interpreting data.
This is a PowerPoint presentation telling the true story of mathematician Abraham Wald. He was employed by the US Army during WW2 to help with the war effort. An excellent activity for students with a range of ability levels.
The information is from “How Not to be Wrong: The Hidden Maths of Everyday Life” by Jordan Ellenberg. I found it an excellent read and would recommend to all maths teachers.
This is the complete module on the topic of organization of data in statistics and economics. It is an exclusive resource where the topics are arranged in a very informative and interesting manner. All the topics are supported by examples and animations. The animated presentation will help you to understand the concept in a very simple and easy way. Each concept is explained with the help of illustrations, images, and outstanding animations. All the concepts are self-explanatory and narrative. This resource will be an added help for your studies nd exam preparations. The presentation is equally important to the students who are studying accountancy and the teachers who instruct the subject.
Total Slides : 47. It's not just a ppt. It's a Complete interactive module with animation and background sound. This will give you an ultimate learning experience for sure.
Contents:
Collection of data
Classification of data
Basis of classification
Variables
Raw data
Statistical Series
Individual series
Continuous series
Frequency Distribution
Types of frequency distribution
Glossary _ Class limits, Frequency, Tally marks, Magnitude etc...
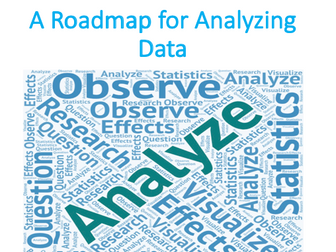
A Roadmap for Analyzing Data is a lecture which is covered within the Statistic or Basic Business Statistic module by business and economics students.
Choosing appropriate statistical methods for your data is the single most important task you face and is at the heart of “doing statistics.” But this selection process is also the single most difficult thing you do when applying statistics! How, then, can you ensure that you have made an appropriate choice? By asking a series of questions, you can guide yourself to the appropriate choice of methods.
Learning objectives:
The questions to ask when choosing which statistical methods to use to conduct data analysis
Rules for applying statistics in future studies and analyses
This lecture discusses:
How to choose the appropriate technique(s) for data analysis for both numerical and categorical variables
Potential questions and the associated appropriate techniques for numerical variables
Potential questions and the associated appropriate techniques for categorical variables
In this File you will find:
A Roadmap for Analyzing Data Lecture Power Point Presentation
Test Bank for A Roadmap for Analyzing Data with 327 Questions with all answers to them
15 Exercises for A Roadmap for Analyzing Data seminar or lecture
Plus reading resource on A Roadmap for Analyzing Data in order to enhance you overall knowledge about the topic.
Once you will purchase this resource please leave a comment!
All resources are compressed in zip file.
You can purchase this teaching resource with more than 20 % Discount by pressing this link. Use coupon code during checkout process: LOVETOTEACH
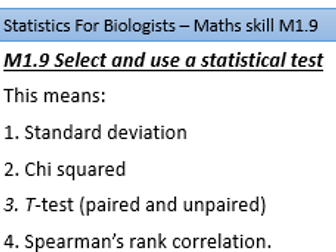
This powerpoint is designed to cover the statistics required in the OCR A Level Biology specification A. It includes worked examples, practice questions and exam questions. It covers the following statistics:
Standard deviation
Chi-squared
T-test
Spearman rank
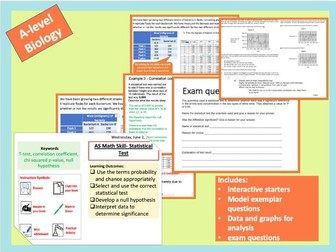
This fully-resourced lesson focuses on all three statistical test:
Student t-test
Correlation coefficient test
Chi-squared test
lesson will explore the following learning outcomes:
Describe when and why you would use each test
Be able to work out the degrees of freedom
Understand what the p value means
Conclude significance of the test based on the results
The detailed PowerPoint has been designed to cover the AQA A-level Biology specification math skills which states that students should be able to select and use statistical test.
A year 10 unit of work covering the following topics:
(1) Questionnaires: Designing questionnaires. Criticising questions. Hypotheses.
(2) Sampling: Simple random sampling. Systematic sampling. Stratified sampling.
(3) Frequency Polygons: Drawing frequency polygons. Interpreting frequency polygons.
(4) Box and Whisker Diagrams: Drawing box and whisker diagrams. The connection between box and whisker diagrams and cumulative frequency diagrams.
(5) Comparing Averages: Revising averages. Choosing the most appropriate average. Comparing averages.
A year 9 unit of work containing the following topics.
(1) The Median: Calculating the median. Calculating the median from a table. Comparing two distributions.
(2) The Median Class: Finding the median class or the estimate for the median.
(3) The Interquartile Range: Calculating the interquartile range of a set of data.
(4) Cumulative Frequency Diagrams: Cumulative frequency tables. Drawing a cumulative frequency diagram. Estimating the median and the interquartile range.
(5) Scatter Diagrams: Drawing a scatter diagram. Types of correlation. Line of best fit.
(6) Probability as a Fraction Writing the probability of an event as a fraction. The probability that an event will not happen. Sample space diagrams. Expected frequency.
Defining and Collecting Data is a lecture which is covered within the Statistic or Basic Business Statistic module by business and economics students.
Nowadays, Data playing an important role in the success of the company. Without reliable and proper data most probably company will fail, while by possessing good data company may get a competitive advantage over main competitors in the market. It is extremely important for future managers to understand how to collect as well as to analyze data, as well as how to work with it. This teaching resource will help you to deliver Defining and Collecting Data lecture as well as seminar in interesting and professional way to your students.
In this lecture you learn to:
Understand the types of variables used in statistics
Know the different measurement scales
Know how to collect data
Know the different ways to collect a sample
Understand the types of survey errors
In this file you will find:
Defining and Collecting Data Lecture Power Point Presentation
Test Bank with 204 different related questions with full answer description and explanation
45 Exercises related to the topic with all answers to them
Two Interesting Case Studies with all answers to case study questions
Defining and Collecting Data Reading Resources file in order to enhance Lecturer/Teacher/Student knowledge
Once you will purchase this resource please leave a comment!
All resources are compressed in zip file.
You can purchase this teaching resource with more than 20 % Discount by pressing this link. Use coupon code during checkout process: LOVETOTEACH
Maths vocabulary flash cards to use on displays, working walls, in lessons etc.
All the words are listed in the order they are introduced in the curriculum.
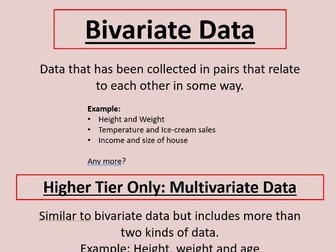
This is an a powerpoint lesson based on introduction to types of data for the course GCSE statistics.
It contains questions and answer to check formatively the understanding of the students.
A lesson that outlines all the different types of data. When it is best to use each type and whether these types of data would be considered valid/reliable?
 Quick View