International
Resources
Topical and themed
Pre-K and Kindergarten
Elementary
Middle school
High school
Special education
Education Jobs
Schools directory
News
Courses
Store
Resources
Education Jobs
Schools directory
News
Search
Tes for schools
Log in
Register
for free
Resources
Education Jobs
Schools directory
News
Magazine
Courses
Log out
Help
Home feed
My list
Courses
My Jobs
Job alerts
My CV
Career preferences
Resources
Author dashboard
Settings
Edit account
Log out
Home
Resources
Jobs
Schools directory
News
Magazine
Courses
Register for free
Log in
Help
Seedhousel's Shop
Add a resource
Edit shop
Average Rating
2.81
(based on 9 reviews)
Seedhousel's Shop
Average Rating
2.81
(based on 9 reviews)
Edit shop
Add a resource
63
Uploads
22k+
Views
4k+
Downloads
All resources
Mathematics
History
Media studies
Personal, social and health education
Citizenship
More
All resources
Relevance
Relevance
Newest
Highest rated
Lowest price
Sale
Seedhousel
OCR Entry Level History: Germany 1925 - 55
(0)
Sale
Seedhousel
OCR Entry Level History: Crime and Punishment
(0)
Sale
Seedhousel
Sampling & Population
(0)
Sale
Seedhousel
Changing the Subject, Formulae & Substitution
(0)
Seedhousel
Sequences
(0)
Sale
Seedhousel
Congruence & Similarity
(0)
Sale
Seedhousel
Bearings & Maps
(0)
Sale
Seedhousel
Circle Theorems
(0)
Sale
Seedhousel
Indices
(0)
Sale
Seedhousel
Data, Charts & Diagrams
(0)
Sale
Seedhousel
Integers
(0)
Bundle Sale
Seedhousel
OCR Entry Level History: Thematic Study and Period Study BUNDLE!
2 Resources
Sale
Seedhousel
Key Stage 3 Topic Booklets
(0)
Sale
Seedhousel
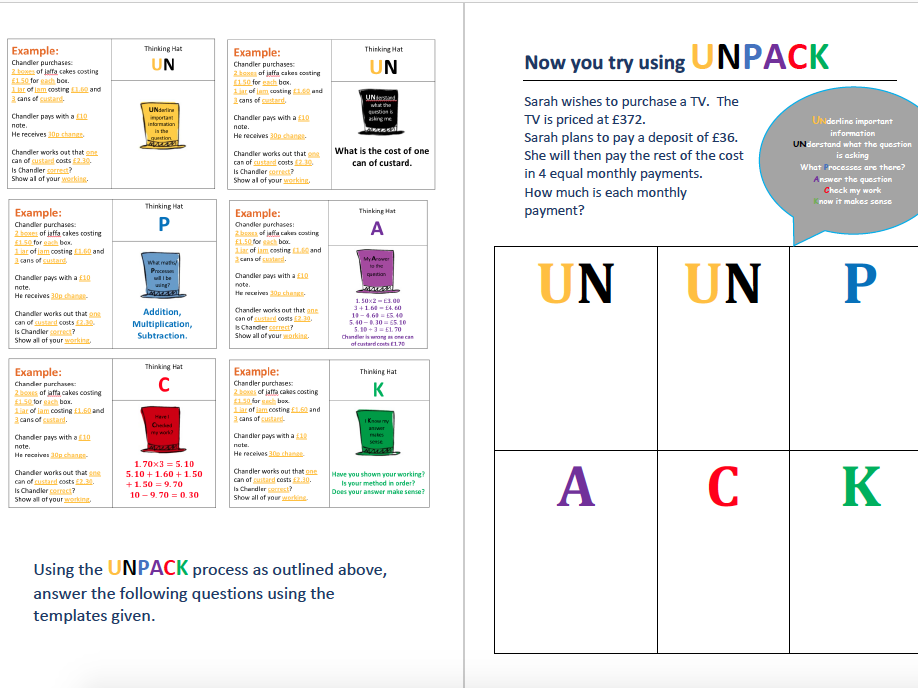
UNPACK Maths Problems
(0)
Sale
Seedhousel
GEOMETRY & MEASURES: Wookbook Bundle 1
(0)
Sale
Seedhousel
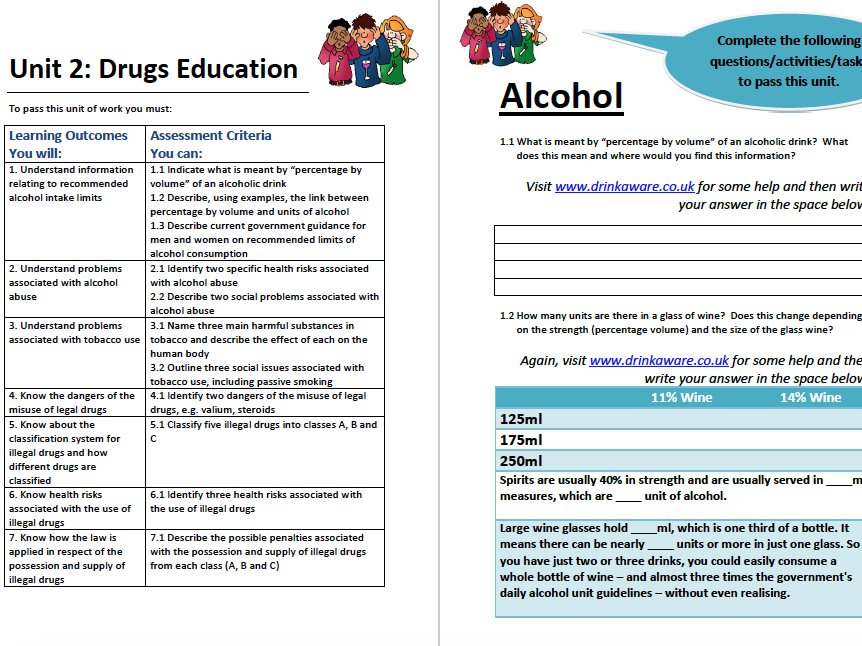
Personal and Social Education: AQA Level 1 Workbook
(0)
Sale
Seedhousel
ALGEBRA: Workbooklet Bundle
(0)
Bundle
Seedhousel
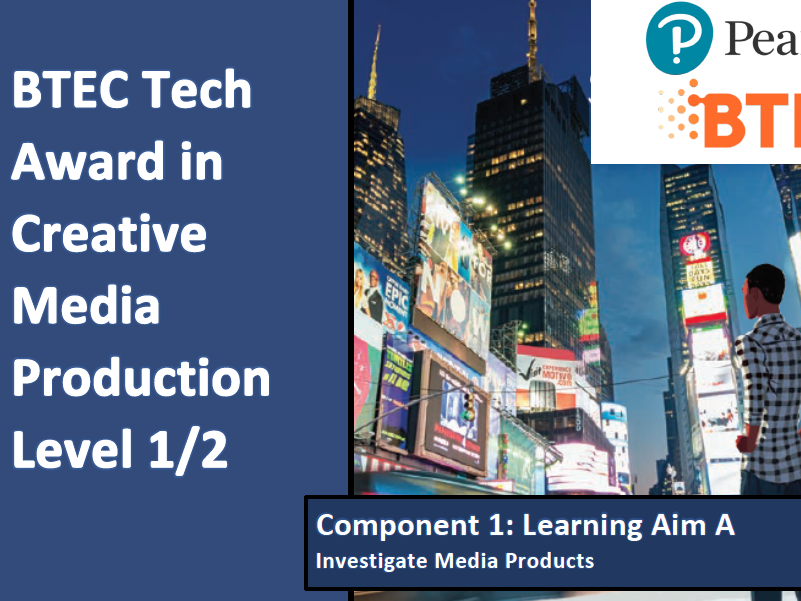
BTEC Tech Award in Creative Media: Component 1
(0)
Seedhousel
Audiences
(2)
Seedhousel
Creating Change: The world I want to live in
(0)
Previous
1
2
3
4
Next