


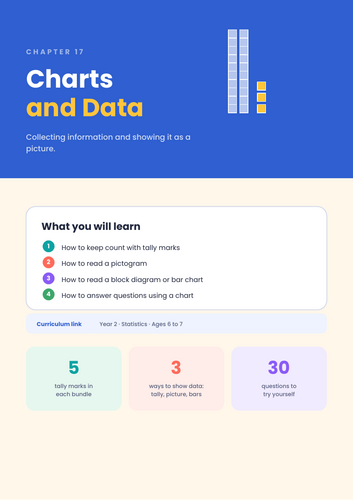
This chapter covers three ways of showing information: keeping count with tally marks in bundles of five, reading a pictogram where one picture stands for one thing, and reading a block diagram or bar chart. Pupils then use those charts to answer questions, including totals, comparisons and how many more.
Two ideas are taught head on. The first is the scale. If the numbers up the side of a chart go up in 2s, a bar reaching the third line is 6, not 3, and counting lines instead of reading the scale is the most common chart error at this age. The second is that how many more means subtract, not simply give the larger number.
Includes a worked explanation, a tips page on reading the title first and using a finger or ruler to track across from a bar to the numbers, common misconceptions addressed directly (counting tally lines one by one, assuming every line is worth one, reading the wrong bar, answering a comparison question with the bigger number), and 30 questions across three sections: warm up, getting stronger and challenge, moving from reading tallies to worded reasoning problems.
Answers included, with a star chart for pupils to track progress and a confidence check-in at the end. A short note for the adult explains why pointing at the scale before every question fixes most mistakes.
Written by a qualified teacher with over ten years’ classroom experience, aligned to the UK National Curriculum for Year 2 statistics (ages 6 to 7).
Supplied as a printable PDF. Suitable for whole-class teaching, small-group intervention, tutoring or home learning.
Something went wrong, please try again later.
This resource hasn't been reviewed yet
To ensure quality for our reviews, only customers who have purchased this resource can review it
Report this resourceto let us know if it violates our terms and conditions.
Our customer service team will review your report and will be in touch.
£1.00