Simple Algebraic Formula Investigation | The Arcade Pass Puzzle! | AlgebraQuick View
MindfulMaths

Simple Algebraic Formula Investigation | The Arcade Pass Puzzle! | Algebra

(0)
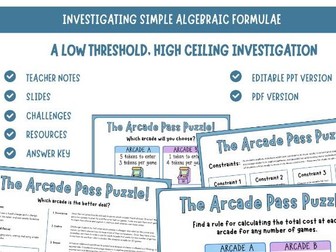
The Arcade Pass Puzzle! | Mini Maths Explorations This engaging maths investigation encourages students to write and use simple formulae, compare costs and develop mathematical reasoning through an accessible, open-ended challenge! Students choose between two arcades with different entry fees and prices per game. As they investigate, they discover that the better deal depends on how many games they play. Students test possibilities, explain their choices and develop a rule for calculating the total cost at each arcade. Part of the Mindful Maths Mini Maths Explorations collection, this resource follows a low-threshold, high-ceiling approach, providing an accessible starting point with opportunities for deeper mathematical thinking. The activity includes four optional constraints (challenges) that change the conditions of the original investigation. Students compare the arcades within a token budget, spend a budget exactly, plan repeated visits and make a shared decision for a group. Mathematical Focus: Writing and using simple formulae, understanding variables, comparing fixed and changing costs, and justifying mathematical decisions. Estimated Time: 25–30 minutes, with flexibility to extend the investigation through additional challenges and mathematical discussion. What’s Included? Introduction to Mini Math Explorations Teacher guidance and teaching sequence Visual provocation Four additional challenges (constraints) Optional student recording sheet Teacher answer key with explanations This download includes both an Editable PowerPoint Version and a PDF Version.
Linear Sequences | Algebraic Investigation | The Fence That Grew! | AlgebraQuick View
MindfulMaths

Linear Sequences | Algebraic Investigation | The Fence That Grew! | Algebra

(0)
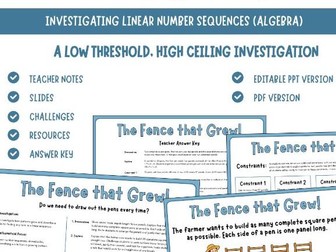
The Fence That Grew! | Mini Maths Explorations This hands-on maths investigation encourages students to explore growing patterns, generate linear number sequences and explain why an algebraic rule works through an accessible, open-ended challenge. The farmer has just seven fence panels and wants to build as many complete square pens as possible. Students arrange the panels and discover how neighbouring pens can share a side. When the farmer needs 20 pens in one straight row, students use what they noticed to develop a rule for finding the number of panels without drawing every pen. Part of the Mindful Maths Mini Maths Explorations collection, this resource follows a low-threshold, high-ceiling approach. Students can start by building or sketching and deepen their thinking by explaining why their rule works for a row of any length. The activity includes four optional constraints (challenges). Students can work within a fixed panel budget, investigate which totals can be used exactly and compare how different layouts affect the number of panels needed. Mathematical Focus: Generating and describing linear number sequences, connecting each term to its position and justifying a general rule using a visual pattern. Estimated Time: 25–30 minutes, with flexibility to extend the investigation through the optional challenges and class discussion. What’s Included? Introduction to Mini Math Explorations Teacher guidance and teaching sequence Visual provocation Four additional challenges (constraints) Optional student recording sheet Teacher answer key with explanations This download includes an editable PowerPoint version and a PDF version.
2D Shape Investigation | The Shape Factory | Shape Reasoning & Problem SolvingQuick View
MindfulMaths

2D Shape Investigation | The Shape Factory | Shape Reasoning & Problem Solving

(0)
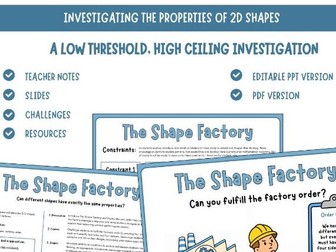
The Shape Factory | Mini Maths Explorations This engaging, hands-on maths investigation encourages students to explore the properties of 2D shapes, compare 4-sided shapes (quadrilaterals), and develop mathematical reasoning through an accessible, open-ended challenge! Students become shape designers at a factory, investigating a manager’s claim that all shapes with four sides and four vertices must be the same shape. Through exploration and discussion, students discover that shapes can share the same number of sides and vertices while having different properties. Part of the Mindful Maths Mini Maths Explorations collection, this resource follows a low-threshold, high-ceiling approach, providing an accessible starting point with opportunities for deeper mathematical thinking. The activity includes four additional constraints (challenges) to encourage systematic exploration, compare shape properties and develop mathematical justification, to extend your students as appropriate. Mathematical Focus: 2D shape properties, quadrilaterals, sides, vertices, comparing and classifying shapes, and mathematical reasoning. Estimated Time: 25–30 minutes, with flexibility to extend the investigation through additional challenges and mathematical discussion. What’s Included? Introduction to Mini Math Explorations Teacher guidance and teaching sequence Visual provocation Four additional challenges (constraints) This download includes both an Editable PowerPoint Version and a PDF Version.
Symmetry Investigation | The Car Park Conundrum | 2D Shape ReasoningQuick View
MindfulMaths

Symmetry Investigation | The Car Park Conundrum | 2D Shape Reasoning

(0)
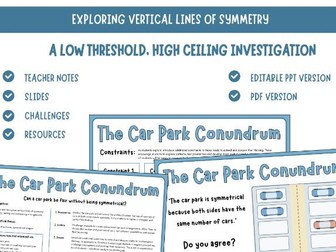
The Car Park Conundrum | Mini Maths Explorations This engaging, hands-on math investigation encourages students to explore vertical line symmetry, create symmetrical arrangements and develop mathematical reasoning through an accessible, open-ended challenge! Students become car park designers, investigating an architect’s claim that equal numbers of cars on both sides of a car park make it symmetrical. Through exploration and discussion, students discover that symmetry depends on matching positions across a line of symmetry, rather than simply having equal numbers. Part of the Mindful Maths Mini Maths Explorations collection, this resource follows a low-threshold, high-ceiling approach, providing an accessible starting point with opportunities for deeper mathematical thinking. The activity includes four additional constraints (challenges) to encourage systematic exploration, challenge assumptions and develop mathematical justification, to really extend your students as appropriate. Mathematical Focus: Vertical line symmetry, symmetrical arrangements, comparing positions and reasoning. Estimated Time: 25–30 minutes, with flexibility to extend the investigation through additional challenges and mathematical discussion. What’s Included? Introduction to Mini Math Explorations Teacher guidance and teaching sequence Visual provocation Printable car park templates Printable car counters (optional: use counters instead) Four additional challenges (constraints) This download includes both an Editable PowerPoint Version and a PDF Version.
3D Shape Investigation | The Shape Stack Challenge | Shape ReasoningQuick View
MindfulMaths

3D Shape Investigation | The Shape Stack Challenge | Shape Reasoning

(0)
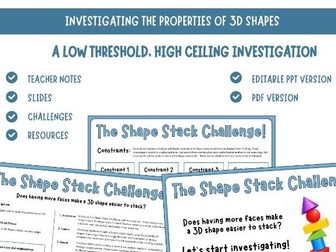
The Shape Stack Challenge | Mini Maths Explorations This engaging, hands-on maths investigation encourages students to explore the properties of 3D shapes, investigate stability and develop mathematical reasoning through an accessible, open-ended challenge! Students become shape stack designers, investigating whether having more faces makes a 3D shape easier to stack. Through practical exploration and discussion, students discover how flat and curved surfaces, shape orientation and the properties of faces can affect the stability of a stack. Part of the Mindful Maths Mini Maths Explorations collection, this resource follows a low-threshold, high-ceiling approach, providing an accessible starting point with opportunities for deeper mathematical thinking. The activity includes four additional constraints (challenges) to encourage systematic exploration, challenge assumptions and develop mathematical justification, to extend your students as appropriate. Mathematical Focus: 3D shape properties, faces, edges, vertices, flat and curved surfaces, comparing shapes and mathematical reasoning. Estimated Time: 25–30 minutes, with flexibility to extend the investigation through additional challenges and mathematical discussion. What’s Included? Introduction to Mini Math Explorations Teacher guidance and teaching sequence Visual provocation Four additional challenges (constraints) This download includes both an Editable PowerPoint Version and a PDF Version.
Remainders as Fractions & Decimals | Task Activity | FractionsQuick View
MindfulMaths

Remainders as Fractions & Decimals | Task Activity | Fractions

(0)
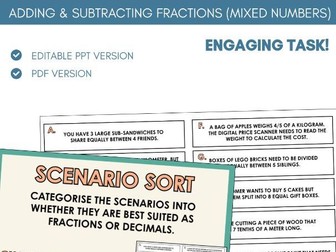
This task allows students to reflect on real life situations where there are remainders after division, and whether remainders are best suited as fractions or decimals. Students organise a range of scenarios into 2 categories, whether they are best as fractions, or whether they are best as decimals. Discuss as a class and then calculate the answers to each division, representing the remainders in the best suited manner. This activity also comes with an additional challenge to provoke higher order reasoning and develop mathematical thinking. This download provides both the Editable PPT Version and the PDF Version.
Adding & Subtracting Mixed Numbers | Worksheet Task Activity | FractionsQuick View
MindfulMaths

Adding & Subtracting Mixed Numbers | Worksheet Task Activity | Fractions

(0)
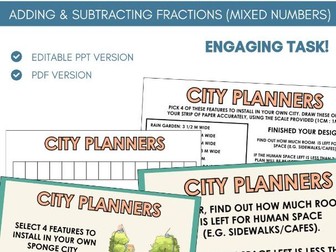
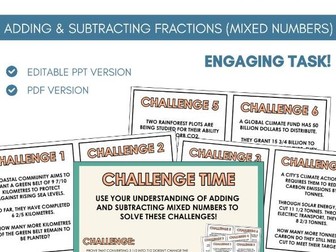
This task allows students to practice the skill of adding and subtracting mixed numbers, in an engaging real life context - designing a city street for a sponge city! Students are given a City Block Map, a long strip of paper representing a 15-meter wide street section. They must choose from a menu of features and select 4 features to install in their own city street. They will calculate the total width used by adding the mixed numbers, before subtracting from the 15m street width to find out how much space is left for human space (e.g. sidewalks/cafes). If the human space left is less than 2 1/4 m, the plan is rejected for being too cramped! This activity also comes with an additional challenge to provoke higher order reasoning and develop mathematical thinking. This download provides both the Editable PPT Version and the PDF Version.
Subtracting Mixed Numbers | Worksheet Task Activity | FractionsQuick View
MindfulMaths

Subtracting Mixed Numbers | Worksheet Task Activity | Fractions

(0)
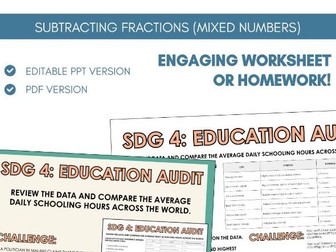
This task allows students to practice the skill of subtracting mixed numbers, in an engaging real life context! Students will use Sustainable Development Goal 4 (SDG4) data to identify various comparisons in schooling hours across different cities by subtracting mixed numbers, ranging in complexity with same / different denominators, before making a conclusive statement based on their understanding of what the data represents. This activity also comes with 3 additional challenges to provoke higher order reasoning and develop mathematical thinking. This download provides both the Editable PPT Version and the PDF Version.
Adding Mixed Numbers | Worksheet Task Activity | FractionsQuick View
MindfulMaths

Adding Mixed Numbers | Worksheet Task Activity | Fractions

(0)
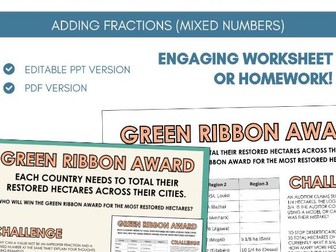
This task allows students to practice the skill of adding mixed numbers, in an engaging real life context! Students will look at the data of 6 different countries and total the amount of hectares their cities have restored by adding the mixed numbers, leading to a total amount for each country to determine who receives the Green Ribbon for highest impact. This activity also comes with 3 additional challenges to provoke higher order reasoning and develop mathematical thinking. This download provides both the Editable PPT Version and the PDF Version.
Applying FDP | Worksheet Task Booklet | Fractions, Decimals & PercentagesQuick View
MindfulMaths

Applying FDP | Worksheet Task Booklet | Fractions, Decimals & Percentages

(0)
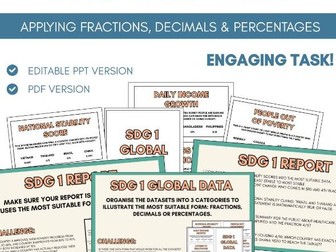
This task allows students to apply their understanding of fractions, decimals and percentages and the relationship between them, in a real life context - analaysing global data! Students will be given a Global Data Pack for SDG 1 with multiple datasets showing different facts, but with a range of different formats. Students need to organise the datasets for the UN and decide which format (FDP) makes each dataset the easiest to read and interpret, and why. To extend students further, they will write or record a report for the UN Secretary-General, answering a range of questions about the data to develop reasoning and problem solving skills. This requires students to convert and organise data and present it in the most suitable form. This activity also comes with 2 additional challenges to provoke higher order reasoning and develop mathematical thinking. This download provides both the Editable PPT Version and the PDF Version.
Adding Fractions | Card Game Activity | FractionsQuick View
MindfulMaths

Adding Fractions | Card Game Activity | Fractions

(0)
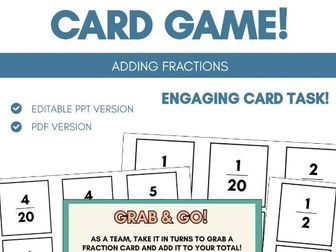
This task allows students to practice the skill of adding fractions in a fun card game! Suggested way to play: Divide the class into two teams. Spread 12 cards face down in an accessible area. Each card has a fraction with a denominator of 20 (e.g., 1/20, 3/20, 4/20). One student from each team runs out, grabs a card, and brings it back. The teams must keep a running total of their fractions until they’ve added 6 fractions. Identify the winner, the team who has the highest calculated total. Once all cards are gone and totals are calculated, reveal a hidden card: ½ and give to each group. What do you notice about this new card? Why can’t we just say the total is ‘plus one’ of something? Is 1/20 the same size as 1/2? This download provides both the Editable PPT Version and the PDF Version.
Add & Subtract Fractions | Different Denominators | Worksheet Task | FractionsQuick View
MindfulMaths

Add & Subtract Fractions | Different Denominators | Worksheet Task | Fractions

(0)
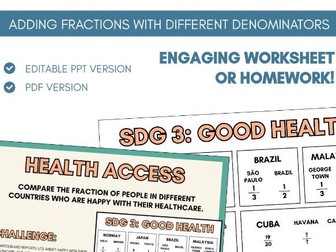
This task allows students to practice the skill of adding and subtracting fractions with different denominators in a real world context! Students will act as Data Analysts for the World Health Organisation, tracking SDG 3: Good Health and Well-being. Student are given data for 6 countries, measuring the availability of doctors across different cities, but the reporting scales (denominators) are different. 4 countries require the addition of fractions, while 2 countries require students to subtract fractions in order to find data for individual cities. Once totals for the countries are found, teams must rank the countries from most access to least access and write a concluding statement for the UN. This activity also comes with an additional challenge to provoke higher order reasoning and develop mathematical thinking. This download provides both the Editable PPT Version and the PDF Version.
Adding & Subtracting Mixed Numbers Flow Chart | Task Activity | FractionsQuick View
MindfulMaths

Adding & Subtracting Mixed Numbers Flow Chart | Task Activity | Fractions

(0)
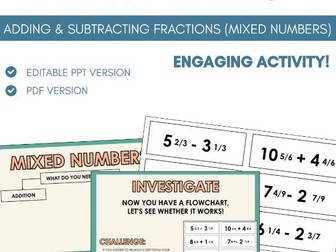
This task allows students to explore the reasoning and processes behind adding and subtracting mixed numbers. Students explore the main paths for adding/subtracting mixed numbers by creating a flow chart. This should split into addition/subtraction, and then branch off into the most effective methods depending on whether they have the same denominators, whether students need to convert, regroup, etc. Once the flow chart has been created, provide students with the 6 calculations with mixed numbers (3 addition, 3 subtraction). Students need to identify whether their flowchart works, or whether it needs to be amended, before calculating the answers to the questions. This activity also comes with an additional challenge to provoke higher order reasoning and develop mathematical thinking. This download provides both the Editable PPT Version and the PDF Version.
Adding & Subtracting Mixed Numbers | Challenge Worksheet Task | FractionsQuick View
MindfulMaths

Adding & Subtracting Mixed Numbers | Challenge Worksheet Task | Fractions

(0)
This task allows students to practice the skill of adding and subtracting mixed numbers by problem solving in an engaging real life context! Place 6 challenge cards around the room, or print for each table. Students move around the room to solve the challenge cards by engaging with the Sustainable Development Goal 13 (SDG13) data (mixed numbers), all about climate action, requiring them to add or subtract mixed numbers in context, or both. This activity also comes with an additional challenge to provoke higher order reasoning and develop mathematical thinking. This download provides both the Editable PPT Version and the PDF Version.
Comparing & Converting FDP | Worksheet Task | Fractions, Decimals & PercentagesQuick View
MindfulMaths

Comparing & Converting FDP | Worksheet Task | Fractions, Decimals & Percentages

(0)
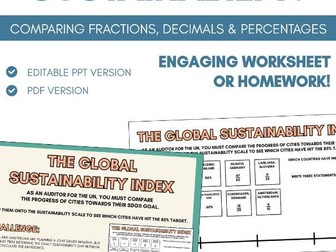
This task allows students to recognise and understand the relationship between fractions, decimals and percentages (FDP) and convert and compare them in a real life context! Students will be given a Global Sustainability Index for Sustainable Development Goal (SDG 11) with a list of 10 data points (fractions, decimals, and percentages). Students need to convert all data into a consistent format (percentages) and place all 10 points on a linear scale to present their findings to the UN to see which cities have reached the sustainability target of 85%. This activity also comes with an additional challenge to provoke higher order reasoning and develop mathematical thinking. This download provides both the Editable PPT Version and the PDF Version.
Comparing & Converting FDP | Worksheet Task | Fractions, Decimals & PercentagesQuick View
MindfulMaths

Comparing & Converting FDP | Worksheet Task | Fractions, Decimals & Percentages

(0)
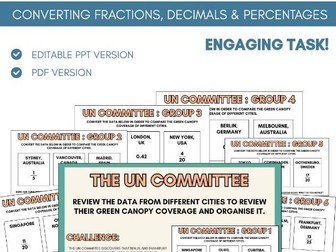
This task allows students to recognise and understand the relationship between fractions, decimals and percentages (FDP) and convert and compare them in a real life context! Students will work as the UN committee. They are given 6 groups of 3 cities each (18 cities total) with mixed FDP data regarding their green canopy coverage. Students need to convert their data to the most suitable form (percentages) then compare the cities’ data. This activity also comes with an additional challenge to provoke higher order reasoning and develop mathematical thinking. This download provides both the Editable PPT Version and the PDF Version.
Converting FDP | Worksheet Task | Fractions, Decimals & PercentagesQuick View
MindfulMaths

Converting FDP | Worksheet Task | Fractions, Decimals & Percentages

(0)
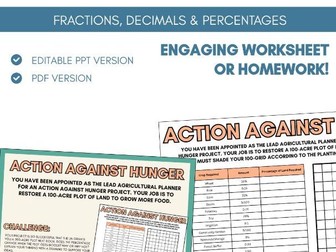
This task allows students to recognise and understand the relationship between fractions, decimals and percentages (FDP) and convert between them. Students are appointed as the lead agricultural planners for an Action Against Hunger project. Their task is to restore a 100-acre plot of land to grow more food. Students must shade the 100-grid according to the Planting Data (shown as either fractions, decimals or percentages) to accurately plan their own 100-acre plot. This activity also comes with an additional challenge to provoke higher order reasoning and develop mathematical thinking. This download provides both the Editable PPT Version and the PDF Version.
Converting FDP | Worksheet Task | Fractions, Decimals & PercentagesQuick View
MindfulMaths

Converting FDP | Worksheet Task | Fractions, Decimals & Percentages

(0)
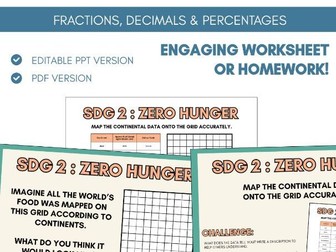
This task allows students to recognise and understand the relationship between fractions, decimals and percentages (FDP) and convert between them. Students will reflect on food crops available across the 7 different continents. Using the data (shown as either fractions, decimals or percentages), students will map out the crops using the 100 grid. This activity also comes with an additional challenge to provoke higher order reasoning and develop mathematical thinking. This download provides both the Editable PPT Version and the PDF Version.
Converting FDP | Worksheet Task | Fractions, Decimals & PercentagesQuick View
MindfulMaths

Converting FDP | Worksheet Task | Fractions, Decimals & Percentages

(0)
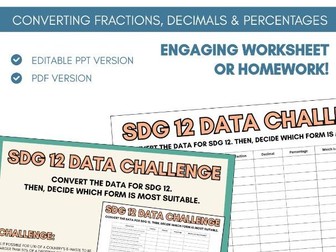
This task allows students to recognise and understand the relationship between fractions, decimals and percentages (FDP) and convert between them. Students read facts for Sustainable Development Goal 12 (SDG12) and convert to all FDP forms. For each, they then need to identify which they feel is the most appropriate form to give FDP real life purpose and meaning. For example,do they think decimals for precision, or do they think percentages because knowing the whole picture is important? Is it a measurement? Use Decimals. Is it about sharing something equally with friends? Use Fractions. Is it a big headline to shock people? Use Percentages. This activity also comes with an additional challenge to provoke higher order reasoning and develop mathematical thinking. This download provides both the Editable PPT Version and the PDF Version.
Equivalent FDP | Card Task Activity | Fractions, Decimals & PercentagesQuick View
MindfulMaths

Equivalent FDP | Card Task Activity | Fractions, Decimals & Percentages

(0)
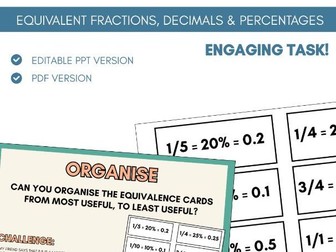
This task allows students to reflect on the purpose and usefulness of the numbers facts related to equivalent fractions, decimals and percentages. Students will organise the FDP equivalence benchmark cards from most useful to least useful. Afterwards, it is suggested to discuss their reflections and any misconceptions before going forward. Explore the purpose of having the three forms, rather than just one: fractions for fairness, decimals for precision, and percentages for the big picture. This will lead nicely into a discussion with students identifying where they have seen this in their own lives each day. This activity also comes with an additional challenge to provoke higher order reasoning and develop mathematical thinking. This download provides both the Editable PPT Version and the PDF Version.
Converting FDP | Worksheet Task | Fractions, Decimals & PercentagesQuick View
MindfulMaths

Converting FDP | Worksheet Task | Fractions, Decimals & Percentages

(0)
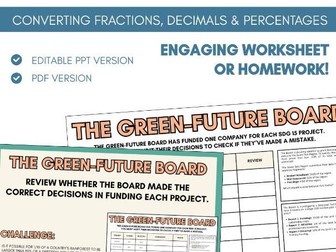
This task allows students to recognise and understand the relationship between fractions, decimals and percentages (FDP) and convert between them in a real life context! Students will review the decisions made by the Green-Future Company board, to decide whether they funded the company who has had the most impact on the world, and rejected the one who had the least impact. To do this, they will need to convert between the impacts, as they are displayed in fractions, decimals or percentages. There are also 2 problem solving questions which require students to apply their understanding of converting FDP. This activity also comes with an additional challenge to provoke higher order reasoning and develop mathematical thinking. This download provides both the Editable PPT Version and the PDF Version.