 Quick View
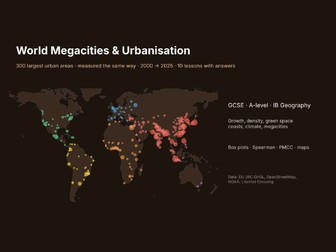
World Megacities & Urbanisation Data Pack: 300 Largest Urban Areas, 2000-2025, 10 Lessons
Compare Tokyo, Lagos, Dhaka and London fairly. The 300 largest urban areas in the world, all measured the same way from EU satellite data (GHSL Degree of Urbanisation).
300 urban areas: population 2025 and 2000, growth, area, density, built-up share, greenness, elevation, distance to a major port and airport, mean temperature and rainfall, other places in the same urban area
10 ready lessons with worked answers: megacities then and now, growth (median, IQR, fastest and slowest), box plots by continent, density, Spearman’s rank (density vs green space), PMCC and regression (size vs area), coastal cities, climate and heat, mapping, own investigation
3 charts (PNG): world map, top 15, growth box plots. Excel workbook, works in Google Sheets.
For GCSE, A-level and IB Geography urbanisation units, and statistics practice. Quality check: two areas whose 2000-2025 growth was over 400% (Luanda, Luxor) were removed as likely source-data errors.
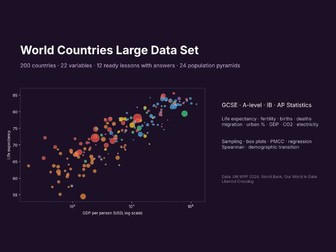
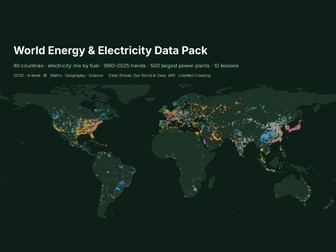
Pairs with the World Countries Large Data Set and the Global Migration & Refugees Data Pack: search LilambdCrossing on Tes.
Data: EU JRC Global Human Settlement Layer, GHS-POP / GHS-SMOD / GHS-BUILT-S R2023A and built greenness R2025A (CC BY 4.0); city names and points from Overture Maps / OpenStreetMap (ODbL 1.0, © OpenStreetMap contributors); elevation from Mapzen terrain tiles, ports from Natural Earth, airports from OurAirports, climate 1991-2020 from NOAA GHCN-Daily (public domain). Not affiliated with or endorsed by the European Commission, OpenStreetMap, NOAA or any data provider.
Licence: the Cities sheet is a database under the Open Database License (ODbL 1.0); you may share and adapt that sheet under the same licence, crediting © OpenStreetMap contributors. The lessons, answers and charts are for use with your own classes; please do not resell or redistribute them (see README and Sources sheets).
Made with AI assistance: built by Lilambd Crossing with Claude (AI) writing the code that assembles the public data; every number comes from the sources above.
Custom data packs, maps or worksheets for your class: submissions@lilambd.com
Missing something? Tell us in one line what you’d gladly pay for, if someone made it — one-line form: https://docs.google.com/forms/d/1tzMQtHsEbMg7JyMk7YGqslHijfNTciByi8wrwjQpUPY/viewform (or email submissions@lilambd.com, subject “Data wish”). If enough people ask, we build it, and you get it free.
Used this? Tell us what you used it for, what was missing, and what you used before: https://docs.google.com/forms/d/1tzMQtHsEbMg7JyMk7YGqslHijfNTciByi8wrwjQpUPY/viewform (one minute, no email asked).
Need a specific file or dataset made? Ask here (no promise, quick form): https://docs.google.com/forms/d/e/1FAIpQLSf6V7YALfwE42SaF1re_cLzAoP96TpRg61jE3Nf7UTWEtWRxA/viewform