


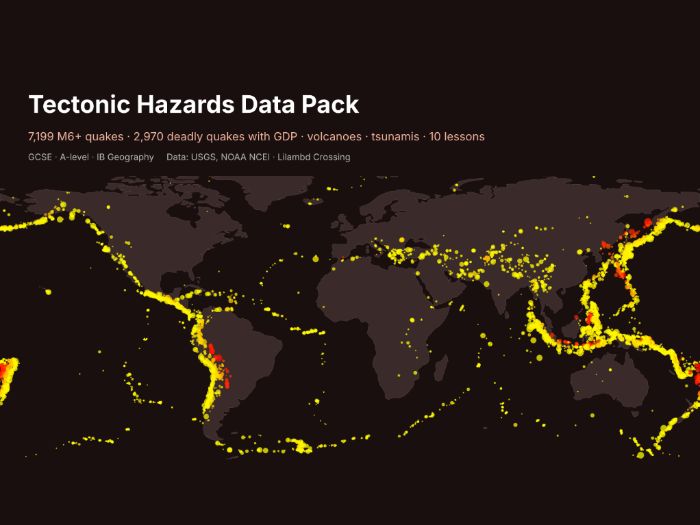

Real hazard data your students can sort, graph and test, with no internet searching needed.
- Every M6+ earthquake 1975-2025 (7,199 rows: date, depth, magnitude, place)
- 2,970 significant earthquakes since 1950, with deaths, houses destroyed and the country’s GDP per capita and income band, for “effects by level of development” questions
- 530 volcanic eruptions (VEI, deaths) and 1,664 tsunamis since 1900
- 10 ready tasks with worked answers: plate-boundary patterns, depth, trends, mean vs median, Spearman’s rank, case-study pairing
- Maps: M6+ quakes by depth on a world map, deaths by income band, blank grid
Data: USGS ComCat and NOAA NCEI/WDS hazard databases (US Government, public); World Bank GDP (CC BY 4.0); UN WPP (CC BY 3.0 IGO); Natural Earth (public domain).
Licence: use with your own classes; please do not resell.
Built with our own code from public data; the lesson tasks were drafted with AI help and every answer was computed from the data.
Custom data packs, maps or worksheets for your class: hello@lilambd.com
Something went wrong, please try again later.
This resource hasn't been reviewed yet
To ensure quality for our reviews, only customers who have purchased this resource can review it
Report this resourceto let us know if it violates our terms and conditions.
Our customer service team will review your report and will be in touch.
£6.00