

A full 60 minute lesson on Quantitative Investigations of Diversity, covering the following LOs…
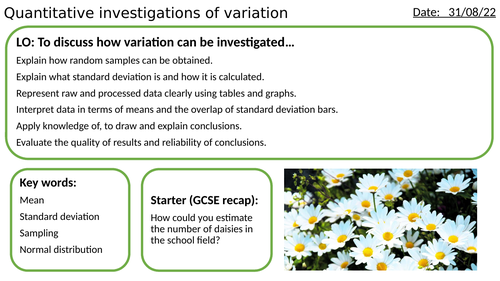
Explain how random samples can be obtained.
Explain what standard deviation is and how it is calculated.
Represent raw and processed data clearly using tables and graphs.
Interpret data in terms of means and the overlap of standard deviation bars.
Apply knowledge of, to draw and explain conclusions.
Evaluate the quality of results and reliability of conclusions.
Lesson includes starter task, recall questions (and answers), and also practice exam questions (and mark scheme).
Get this resource as part of a bundle and save up to 33%
A bundle is a package of resources grouped together to teach a particular topic, or a series of lessons, in one place.
Something went wrong, please try again later.
Great resource, saved me loads of planning time over the weekend. Ready to use, only had to add my school-policy starters.
Great resource :) saved me so much time! Thank you xx
Report this resourceto let us know if it violates our terms and conditions.
Our customer service team will review your report and will be in touch.
£3.00