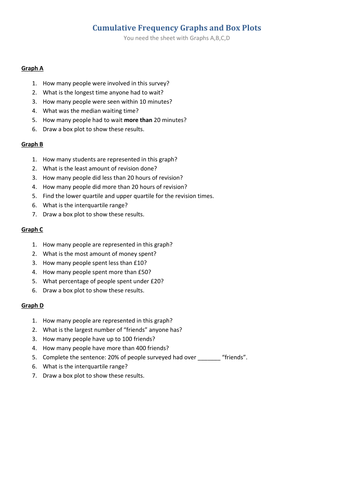


Some simple interpretation questions for cumulative frequency graphs leading on to drawing box plots.
The worksheet (word file) includes the answers.
The PDF is meant to be drawn on and has space under each CF graph for a box plot to be drawn.
Something went wrong, please try again later.
Exactly what I was looking for with my Y11 Crossover students. They had struggled with a similar exam question in the last lesson. Thanks for sharing
Lovely examples to interpret CF graphs and "recycle" information as Box Plots.
Report this resourceto let us know if it violates our terms and conditions.
Our customer service team will review your report and will be in touch.
£0.00