
This resource is for KS4 students who have studied boxplots, histograms and cumulative frequency diagrams. The resource is labeled an ‘activity’, but it will cover most of a lesson. There are two parts to the resource: the presentation and the handout for the students.
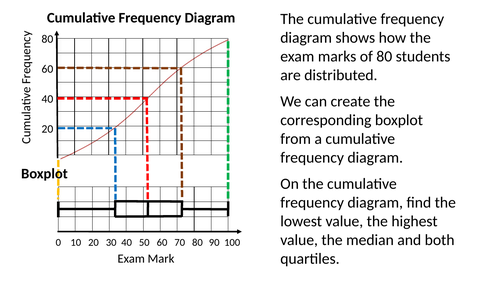
The introduction covers the connections between a cumulative frequency diagram and a boxplot and between a cumulative frequency diagram and a histogram.
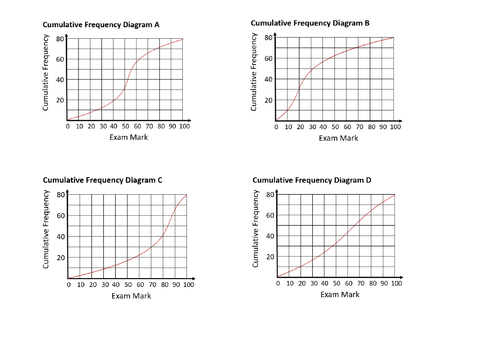
Students are then to match each cumulative frequency diagram to the corresponding boxplot and histogram, as well as choosing the description that best describes the distribution of marks. The extension is to find the mean exam mark for each distribution.
Something went wrong, please try again later.
I really like this and it is the first time I've seen someone put the connections together so well.
Great activity, I just used the boxplots and cf diagrams to match as hadn't covered histograms yet but plan to come back to this when we do. I also liked the interpretations, class responded well to them being displayed on the board and matching with the right cf/boxplot. Thank you
Report this resourceto let us know if it violates our terms and conditions.
Our customer service team will review your report and will be in touch.
£0.00