


This resource is for BTEC: UNIT 8 – Using Statistics for Science under LO2: Correlation Testing (P4, M4, D4)
In this lesson, students will learn how to:
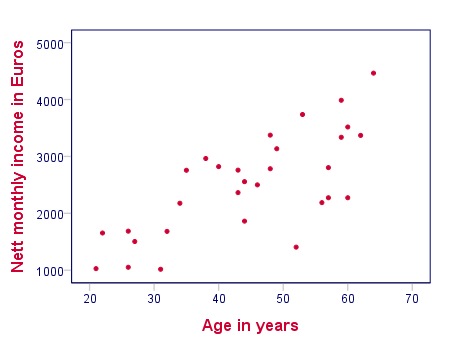
Interpret scatter diagrams for bivariate data.
Calculate and interpret the value of the product-moment correlation coefficient.
Perform a significance test for r, the product moment correlation coefficient.
Use the table of critical values for correlation coefficients.
In this lesson, students will learn how to:
Interpret scatter diagrams for bivariate data.
Calculate and interpret the value of the product-moment correlation coefficient.
Perform a significance test for r, the product moment correlation coefficient.
Use the table of critical values for correlation coefficients.
Something went wrong, please try again later.
Detailed notes on these two tests. The PMCC one has some particularly clear examples.
Report this resourceto let us know if it violates our terms and conditions.
Our customer service team will review your report and will be in touch.
£0.00