


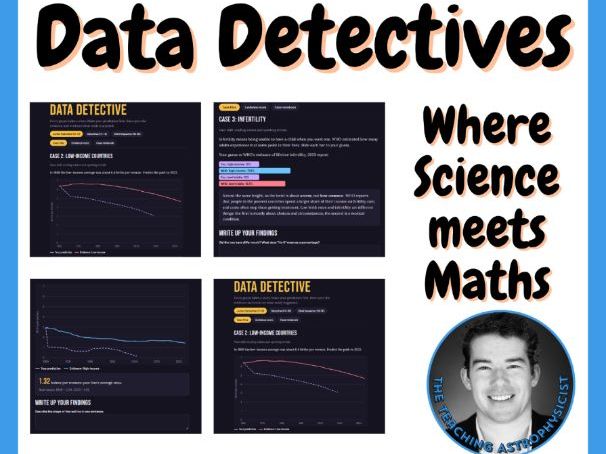

Infertility affects roughly 1 in 6 adults worldwide according to the World Health Organization, which makes it one of the most relevant real-world topics for middle school and high school students to study through science and maths. Understanding how fertility rates, infertility prevalence and population projections differ between high-income, middle-income and low-income countries helps students connect biology, health and global issues to the graphs and statistics they meet in everyday news.
Data Detective: Case Files on Fertility is a ready-to-use interactive classroom resource for ages 11 to 18 that turns World Bank, WHO and United Nations data into four predict-then-reveal investigations. Students draw their own predicted trends, compare them with the real data, and explore a what-if lab that shows how changing fertility could shape future populations. Three levels (Junior Detective, Detective and Chief Inspector) build graph reading, percentage change, rates of change and scientific reasoning, so one resource supports mixed-ability science and maths classes.
You receive an interactive HTML activity with a fillable case notebook and JSON export, plus a printable Word document and PDF for classrooms without devices. Because it treats fertility and infertility sensitively at a population level, it is a practical, evidence-based way to teach data literacy, population science and global health in a single engaging unit.
WHAT’S INCLUDED IN THIS DATA DETECTIVES INFERTILITY SET:
- Interactive HTML activity
- Three levels: Junior Detective (11-13), Detective (14-16) and Chief Inspector (16-18). The level changes the questions and the maths tools.
- Case 1, high-income countries: Students draw their predicted fertility trend from 1960 to 2023, then see the real World Bank data and how far off they were.
- Case 2, low-income countries: The same predict-then-reveal format, comparing the trend with Case 1.
- Case 3, infertility: Students guess what share of adults experience infertility, then see WHO’s estimates (17.8% in high-income countries, 16.5% in low- and middle-income countries).
- Case 4, The Future File:
- Students predict the world population in 2100, then see the UN projection.
- A what-if lab lets them raise “extra infertility” from 0 to 20% for each income group and watch the projected population change.
- Higher levels get a comparison table, and Chief Inspector adds halving and doubling times.
- Evidence Room: An open exploration space with year sliders and lines for each income group. Detective level adds the replacement-level line (2.1), and Chief Inspector adds a log scale and a two-year change calculator.
- Case notebook: Fillable answer boxes (two questions per level per case), name and class fields, a reflection question, autosave and JSON export/import.
- Microsoft Word Doc Version
- PDF Printable Version
Something went wrong, please try again later.
This resource hasn't been reviewed yet
To ensure quality for our reviews, only customers who have purchased this resource can review it
Report this resourceto let us know if it violates our terms and conditions.
Our customer service team will review your report and will be in touch.
£3.15