


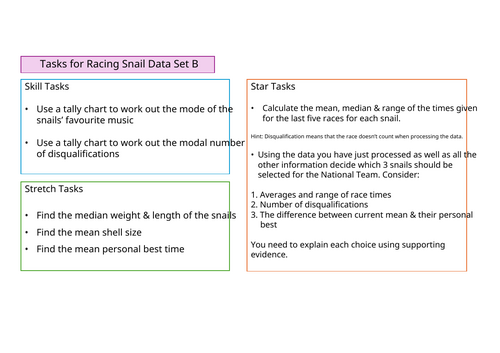
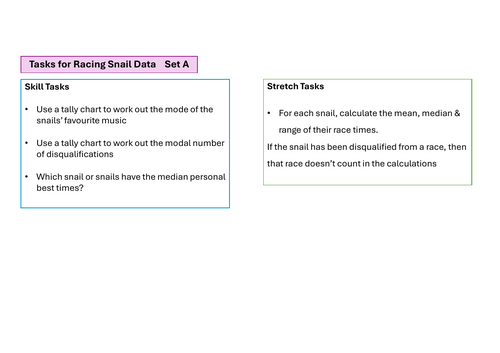
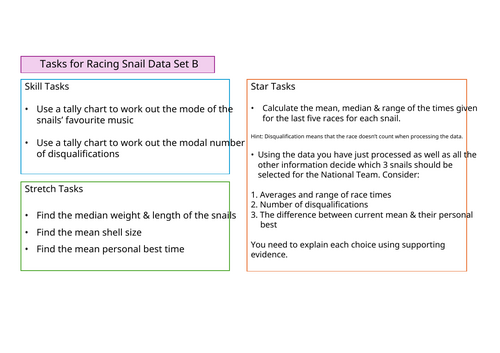
Included: editable powerpoint, pdfs of task sheets & data for students. Tasks cover a range of different skills involved in data processing. Potential for lots of flexibility & differentiation. Task sheet B is more challenging than task sheet A.
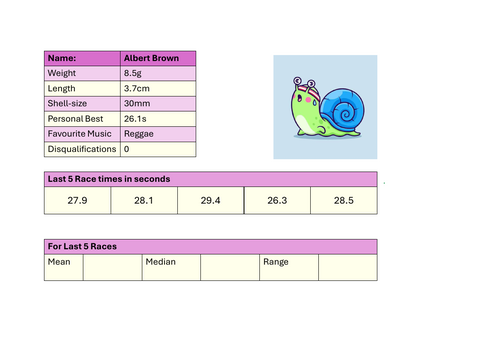
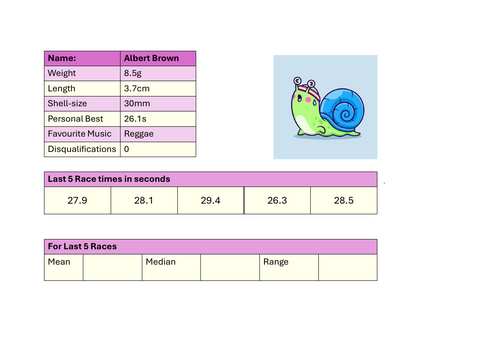
A quirky resource suitable for KS2-4 (depending on the sense of humour of your class!) . It gives the data for the top ten ‘racing snails’ on the local racing circuit and a series of tasks that can be done to process the data. Tasks range in difficulty from tally charts to determine mode of numerical & non-numerical data, through to calculating mean, median & range of decimal data and then using the data to make a decision & present the conclusion of which 3 snails should be put forward to the national team backed up by their data finding.
The data set is deliberately bulky, and needs navigating carefully. Good for independent work/assessment or group work, particularly if the data can be shared electronically as a pdf.
No answers included yet - but will add when I have them.
NB: I don’t own the images used,
Something went wrong, please try again later.
This resource hasn't been reviewed yet
To ensure quality for our reviews, only customers who have downloaded this resource can review it
Report this resourceto let us know if it violates our terms and conditions.
Our customer service team will review your report and will be in touch.
£0.00