

One FULL LESSON on drawing and interpreting frequency polygons.
Dependent on ability, this lesson could be split into two lessons.
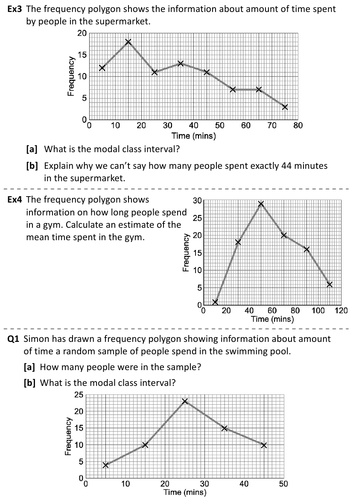
The second half of the lesson could present a good opportunity to teach students how to calculate the mean value in a calculator using the statistics mode.
Contents of download:
- Clicker version: Normal PowerPoint lesson with which you can use a clicker / mouse / keyboard to continue animations and show solutions.
- Worksheets (including example and extension).
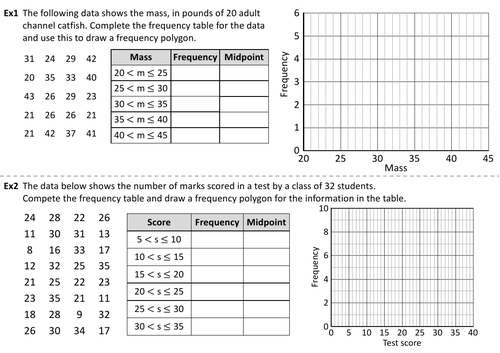
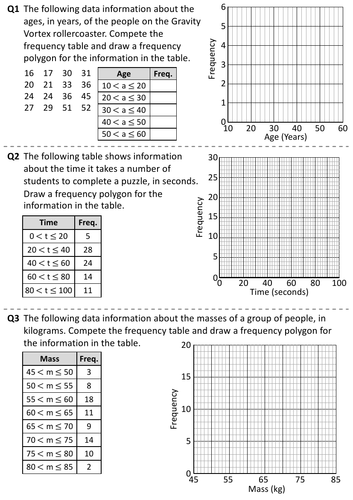
We are learning about: Frequency Polygons
We are learning to: Draw and interpret frequency polygons.
Differentiated objectives:
- Developing learners will be able to complete a grouped frequency table for a set of data.
- Secure learners will be draw a frequency polygon from a grouped frequency table.
- Excelling learners will be able to solve unfamiliar problems involving frequency polygons.
Main: Walkthrough examples followed by practice questions on worksheets. Starts with basic calculating the area moving on to finding a missing side and angle. All solutions given on PPT.
Something went wrong, please try again later.
Amazing thank you
Really well done resource
Perfect - so clear and easy to use!
Super resources! Thank you!
Easy to use; excellent. Thank you.
Report this resourceto let us know if it violates our terms and conditions.
Our customer service team will review your report and will be in touch.
£0.00