
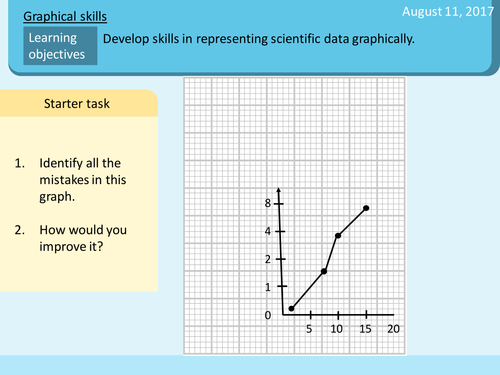
Topic: Handling data, scientific methods, independent and dependent variables, plotting graphs, analysing graphs, linear and proportional relationship
Level: GCSE, key stage 4
I am following the AQA science (physics) syllabus but this resource is suitable for anyone teaching KS3 or KS4 science (specifically physics). I will use this lesson to teach a class of year 9, beginning their GCSE course.
Resources:
1. Powerpoint slides: powerpoint slides, compatible with a worksheet/handout. Slides contain information and tasks for pupils.
2. Notes (editable documents) for pupils: Use this as worksheet or handout. Pupils can take notes during lesson or complete tasks in this editable document.
Hope this resource is helpful for you. Please do let me know if there's any suggestions for improvement. I aim to upload more lessons following this topic.
Enjoy!
Get this resource as part of a bundle and save up to 62%
A bundle is a package of resources grouped together to teach a particular topic, or a series of lessons, in one place.
Something went wrong, please try again later.
Well scaffolded, only one graph to plot for practice.
very solid lesson. Used with my year 7s who were still unable to draw graphs and by the end all students could see their previous mistakes and draw a graph from data with next to no help.
Report this resourceto let us know if it violates our terms and conditions.
Our customer service team will review your report and will be in touch.
£3.00