

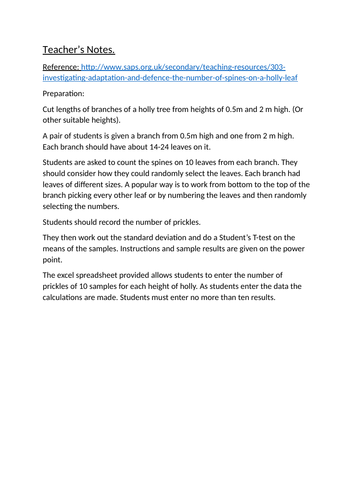
Make statistics real by using this practical investigation to test a hypothesis. This teaches students how to do standard deviation and T-test as well as why they do it . Written for OCR but can be applied to other A levels. The data they collect is easy and quick and gives good results! This is a whole lesson resource. The power point asks questions and gives instructions. There are also sample results given. The resources includes an active spreadsheet that makes some calculations for the students. I was skeptical that this would “work” to give a significant difference between the means - but it did.
Something went wrong, please try again later.
This resource hasn't been reviewed yet
To ensure quality for our reviews, only customers who have purchased this resource can review it
Report this resourceto let us know if it violates our terms and conditions.
Our customer service team will review your report and will be in touch.
£3.00