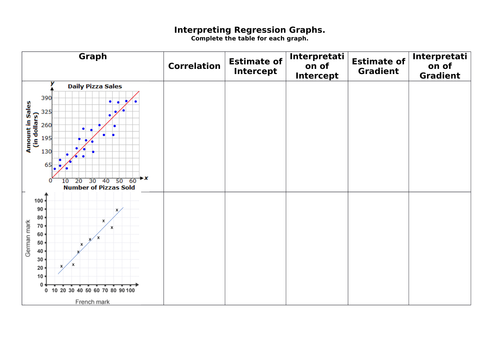


Seven examples of regression graphs are given with lines of best fit added. Examples of positive, negative and linear approximation relationships are used. Students are asked to state the correlation then estimate and interpret the intercept and gradient of each graph. The students need to know how to estimate the gradient from 2-points on the line and find the intercept by extrapolation. The task is presented in two forms (1) a write on worksheet and (2) a cut up , mix and match activity. The second option is designed to encourage group work and discussion. There is a set of extension questions, one for each graph that promote further consideration on the strengths and limitations of lines of best fit. Answers are provided in a separate file. The activity is designed to be used with AS Mathematics students however it is accessible to Higher Tier GCSE Mathematics and GCSE Statistics students.
Something went wrong, please try again later.
Thanks so much. Great for Higher Applications, illustrates just what I wanted.
Perfect! Exactly what I was looking for.
This is excellent. Thank you for providing this resource freely!
This is an excellent resource for teaching the new linear A level. Thanks so much for producing it and sharing.
Report this resourceto let us know if it violates our terms and conditions.
Our customer service team will review your report and will be in touch.
£0.00