
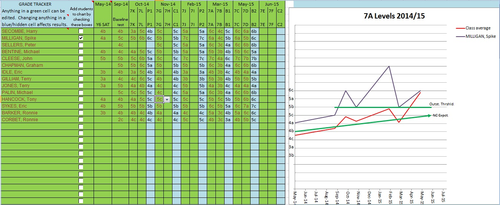

Excel (Office 2007 - macro enabled) workbook that provides a visual track of pupil progress. This is designed for a Year 7 Science class of 25 students. Once baseline data is entered (either Y6 SAT or Sept. baseline test results or both) then a class average is plotted (red) together with a 3 sub level increase target for the class (Outstanding). NC expectations are also shown.
Individual students can be added or removed from the graphic at will.
As it is based on NC Y7 Science, which I teach two units at a time, data points that are plotted are an average of two levelled tasks every six weeks or so. Could easily be adapted for any KS3 subject.
The workbook is protected but students and their levels can be changed as well as the dates of the assessed tasks. Everything else is automatic.
Suggestions welcome.
Something went wrong, please try again later.
This resource hasn't been reviewed yet
To ensure quality for our reviews, only customers who have downloaded this resource can review it
Report this resourceto let us know if it violates our terms and conditions.
Our customer service team will review your report and will be in touch.
$0.00