


This resource covers:
KS3 (Ages 11-14): Maths (statistics and reasoning mathematically)
- describe, interpret and compare observed distributions of a single variable through appropriate graphical representation involving discrete, continuous and grouped data; and appropriate measures of central tendency (mean, mode, median) and spread (range, consideration of outliers)
- interpret when the structure of a numerical problem requires additive, multiplicative or proportional reasoning
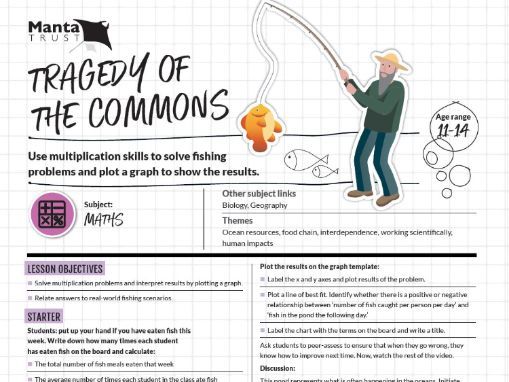
It also covers a topic that students may meet in GSCE biology: Sustainable fishing.
This lesson plan begins with watching a short video clip which poses a maths problem. Students are encouraged to work out the maths problem and then practice their skills at creating a graph. The maths problem incorporates the theme of sustainable fishing and so there is also an environmental theme to this lesson.
Something went wrong, please try again later.
This resource hasn't been reviewed yet
To ensure quality for our reviews, only customers who have downloaded this resource can review it
Report this resourceto let us know if it violates our terms and conditions.
Our customer service team will review your report and will be in touch.
£0.00