

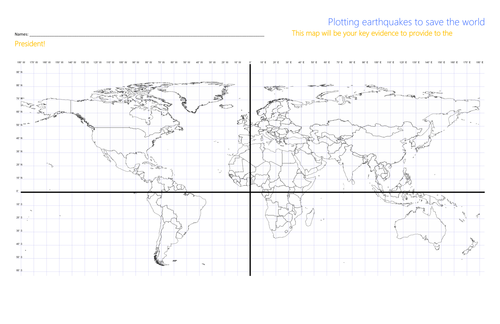
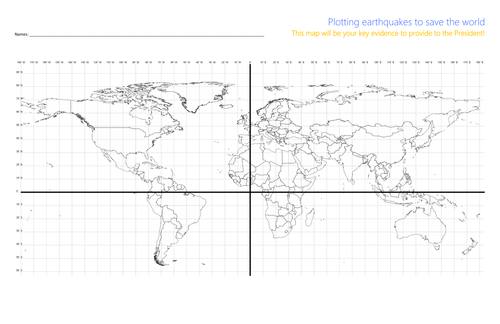

In the Mapping Earthquakes to Save the World activity, students leverage real-time data to plot earthquakes on a world map. The fate of the world is in their hands – the President of the United States has asked for their help to save humankind. Students identify patterns in their data and connect earthquakes with tectonic plates, making recommendations back to the President about where people are safe and where people are most at risk. This activity was heavily inspired by a project from the Stevens Institute for Technology Center for Innovation in Engineering and Science Education.
For Google Docs and Slides links, please visit https://www.ctlessons.org/science/mapping-earthquakes.html
Topics addressed:
Plate tectonics and earthquakes
GPS coordinates
Primary CT concept: pattern recognition. Students are finding real-world, raw data and visualizing it geographically, then looking for trends and patterns in that data to draw conclusions about where and why earthquakes are happening and are likely to happen again.
Students will be able to:
Develop a hypothesis about what causes earthquakes and collect data to evaluate their hypothesis
Plot points on a world map using GPS coordinates
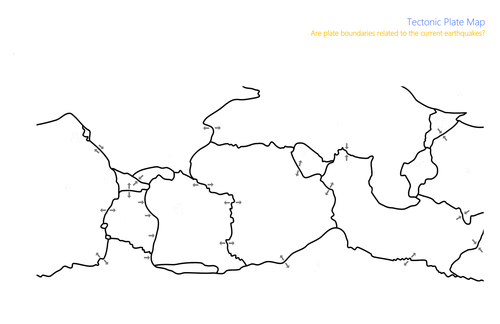
Recognize geographic patterns on a map and relate them to tectonic plate boundaries
Compose a persuasive letter explaining their findings using scientific reasoning and citing data
Prep:
Sync with your students’ math teacher(s) to understand your students’ experience to date with the Cartesian coordinate plane, so you can appropriately frame GPS coordinates for them
Print the tectonic plate overlay on vellum paper or transparency film that is designed for your printer (laser or inkjet). In a pinch, printing it on relatively low-weight normal white paper will work as well – students will just have to hold their papers up to the light to see through.
Suggested lesson breakdown:
This lesson can be run within a single class period, or can easily be split over two days.
10min – introduction of the project
5min – students form hypotheses
10min – how to plot with GPS coordinates
15-20min – students plot earthquakes from live GPS data
5-10min – students plot earthquakes from live map data
5min – students compare their maps with tectonic plate overlays
10min – full class discussion on findings
30-45min – students write letters on their findings to the President
For further information and relevant standards, please visit https://www.ctlessons.org/science/mapping-earthquakes.html
Something went wrong, please try again later.
This resource hasn't been reviewed yet
To ensure quality for our reviews, only customers who have downloaded this resource can review it
Report this resourceto let us know if it violates our terms and conditions.
Our customer service team will review your report and will be in touch.
$0.00