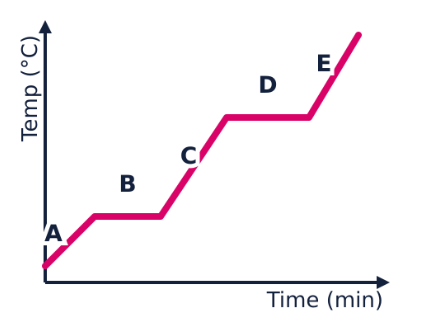


Help your Year 8 students master heating and cooling curves with this clear, visually engaging Lesson 6 PowerPoint and worksheet pack. Learners explore how temperature changes during melting and boiling, what flat sections represent, and how particle behaviour links to the graph. The worksheet challenges students to analyse real heating‑curve data—identifying states, state changes, and key points such as melting and boiling. A no‑prep, high‑impact resource that builds confidence in graph interpretation and deepens understanding of particle theory.
Get this resource as part of a bundle and save up to 33%
A bundle is a package of resources grouped together to teach a particular topic, or a series of lessons, in one place.
Something went wrong, please try again later.
This resource hasn't been reviewed yet
To ensure quality for our reviews, only customers who have purchased this resource can review it
Report this resourceto let us know if it violates our terms and conditions.
Our customer service team will review your report and will be in touch.
£1.50