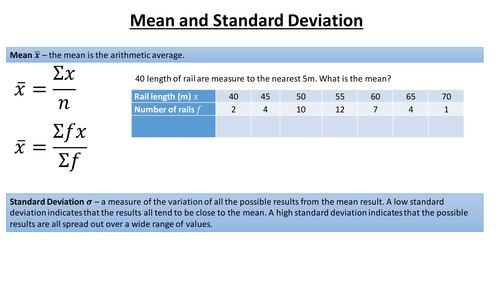

This presentation focuses on what standard deviation really is. We look at some examples of data that all have the same mean, but where the variation in data is different. This enables us to see how the standard deviation can be useful and why we need to square the values before square rooting.
A good visual representation to enhance understanding of what the standard deviation of a set of data means.
A good visual representation to enhance understanding of what the standard deviation of a set of data means.
Something went wrong, please try again later.
Many thanks for sharing
Clear visual powerpoint explaining reasons for and how to calculate standard deviation. Thank you for sharing.
Report this resourceto let us know if it violates our terms and conditions.
Our customer service team will review your report and will be in touch.
£0.00