

Distance-Time Graphs
Key Stage: 3 ★
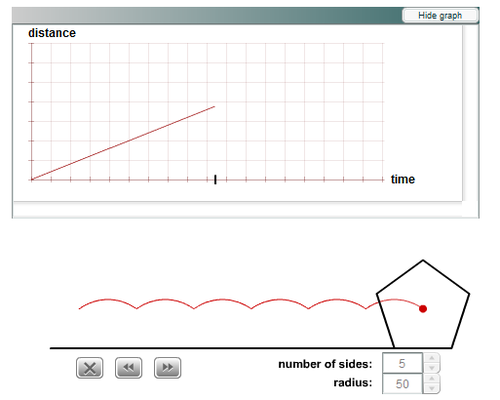
A regular polygon rolls along, and the graph plots the distance moved by the dot.How do the location of the dot and the number of sides affect the graph?
This problem provides a visual context in which to consider how distance / time graphs represent movement over time. It allows opportunity for learners to discuss and refine their ideas. Asking learners to predict, to justify their predictions and to consider modifying their views can help address misconceptions and improve understanding.
This resource has comprehensive teachers' notes and resources, linked from the problem page. This includes possible approaches and key questions, as well as possible support and extensions.
The file attached is a HTML file, which, when opened, automatically redirects you to the problem on the NRICH website.
Key Stage: 3 ★
A regular polygon rolls along, and the graph plots the distance moved by the dot.How do the location of the dot and the number of sides affect the graph?
This problem provides a visual context in which to consider how distance / time graphs represent movement over time. It allows opportunity for learners to discuss and refine their ideas. Asking learners to predict, to justify their predictions and to consider modifying their views can help address misconceptions and improve understanding.
This resource has comprehensive teachers' notes and resources, linked from the problem page. This includes possible approaches and key questions, as well as possible support and extensions.
The file attached is a HTML file, which, when opened, automatically redirects you to the problem on the NRICH website.
Something went wrong, please try again later.
Another nice lesson idea from n-rich, this link is on the topic of angles and polygons. I like these lesson ideas as they teach the topic in an interesting and different way and come with a full set of teacher notes, hints for pupils and solutions for ease of planning. Would make an ideal investigation lesson as a paired or group work task.
Report this resourceto let us know if it violates our terms and conditions.
Our customer service team will review your report and will be in touch.
£0.00