


Practise plotting straight-line graphs: complete a table of values, plot the points and draw the line. 16 questions, full answers included.
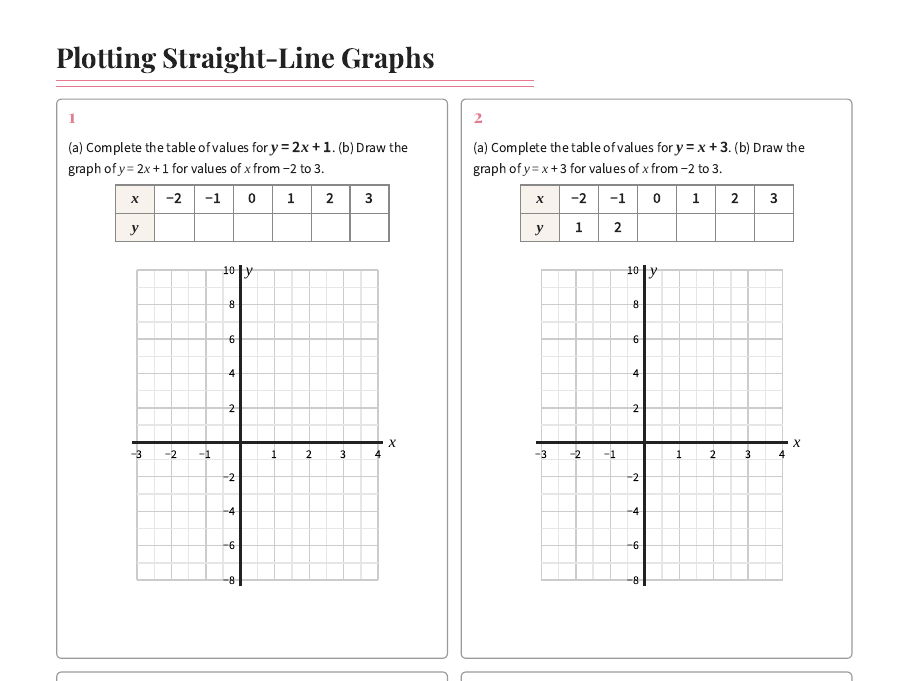
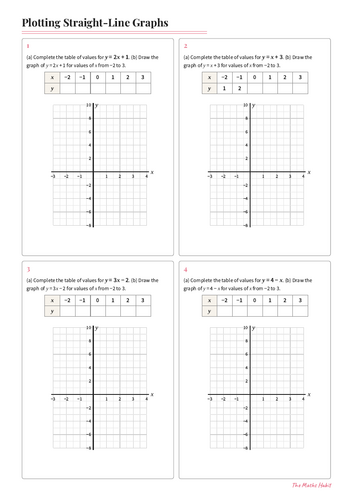
Worksheet (2 pages): eight questions, each with a large grid, four to a page. Students complete a table of values from x = −2 to 3 for lines such as y = 2x + 1, y = 4 − x and y = −3x + 2, then plot and join the points. One early table is partly filled in as a model, and by the last two questions students make their own table.
Further practice (2 pages): eight questions graded by difficulty: drawing a line with no table given, a line with a fractional gradient, x + y = 5, reading where a line crosses the x axis, and real-life graphs for a plumber’s call-out charge, two taxi firms’ fares, and a tank emptying of water, finishing with spotting the mistake in a line someone else has drawn.
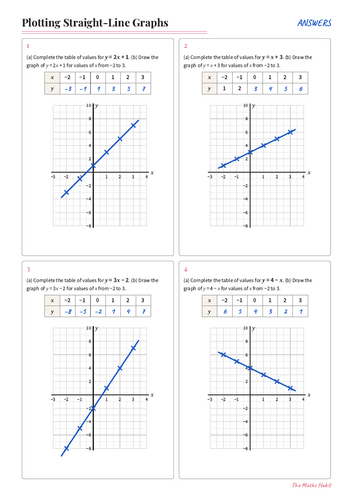
Answers to all 16 questions are included as a separate file.
Suitable for GCSE Foundation (AQA A9) and for Key Stage 3 classes working on plotting straight-line graphs.
AI was used to help create this resource, working from my own lesson design.
Something went wrong, please try again later.
This resource hasn't been reviewed yet
To ensure quality for our reviews, only customers who have downloaded this resource can review it
Report this resourceto let us know if it violates our terms and conditions.
Our customer service team will review your report and will be in touch.
£0.00