
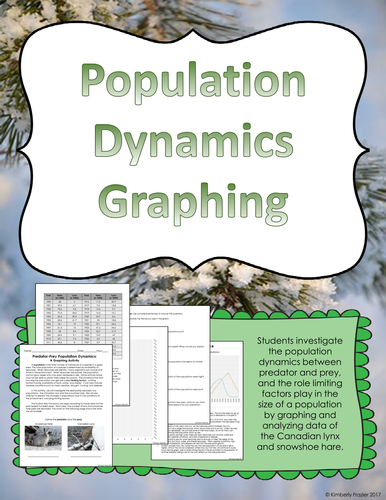
Students investigate the population dynamics between predator and prey, and the role limiting factors play in the size of a population by graphing and analyzing data of the Canadian lynx and snowshoe hare.
I use this activity with my sixth grade students during our unit on ecosystems. We complete it as a class activity. You could make it an option in a choice project, a learning extension for higher level students, or an activity for a science center.
The final page includes the completed graph and answers to the analysis questions.
This activity aligns to NGSS Standard MS-LS2-1. It also aligns to CCSS Math Standard CCSS.MATH.CONTENT.5.G.A.2 .
Key Vocabulary and related topics: ecosystems, populations, graphing, limiting factors, resources, predator, prey, independent and dependent variables, coniferous forest food web
Total Pages: 5
Answer Key Included
Something went wrong, please try again later.
This resource hasn't been reviewed yet
To ensure quality for our reviews, only customers who have purchased this resource can review it
Report this resourceto let us know if it violates our terms and conditions.
Our customer service team will review your report and will be in touch.
$2.00