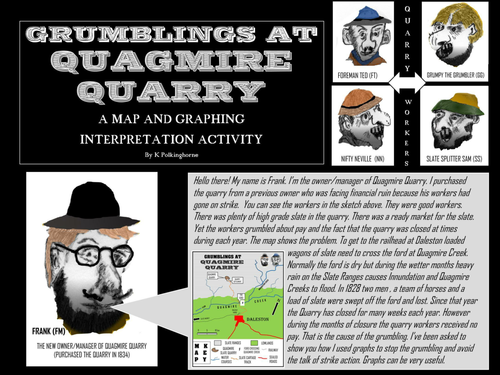


This is a unit with a fun twist. Graphs are an important part in the study of Geography. Here is a unit that explains step by step how to draw a simple line graph and develop a column/bar graph. This unit begins with a situation causing grumblings of workers at Quagmire Quarry. A map further enhances the understanding of the problem - water cover over the ford at Quagmire Creek. Students can then role play the discussion between the new manager and his 4 quarry workers from the screen or hard colour-coded copies (5 needed) can be provided for 'live' performances. Integrated with the story is the need for students to create 2 graphs (replicas of those developed by the Quarry Manager and shown to his workers). Now students can see the value of graphs as visual resources which make the situation easier to understand. Students enjoy this approach and in the process create and use graphic materials they develop. This unit can standalone. There are 2 black and white attachments which are guides for developing the graphs. There is one attachment containing the colour-coded scripts of the discussions between the new manager and his four quarry workers. You only need 5 copies of the colour-coded script to give to 5 students who will play the characters.
Be entertained with your students as they become involved in removing the grumblings at Quagmire Quarry. Become involved in the situation and help find solutions.
Be entertained with your students as they become involved in removing the grumblings at Quagmire Quarry. Become involved in the situation and help find solutions.
Something went wrong, please try again later.
This resource hasn't been reviewed yet
To ensure quality for our reviews, only customers who have downloaded this resource can review it
Report this resourceto let us know if it violates our terms and conditions.
Our customer service team will review your report and will be in touch.
£0.00
