

Do you know that, probability application areas includes: modeling of text and Web data, network traffic modeling, probabilistic analysis of algorithms and graphs, reliability modeling, simulation algorithms, data mining, and speech recognition
More so, Probability means the mathematical chance that something might happen and this is used in numerous day- to-day applications, which includes: weather forecasts, Sports Strategies, Insurance Options, Games and Recreational Activities, Making Business.
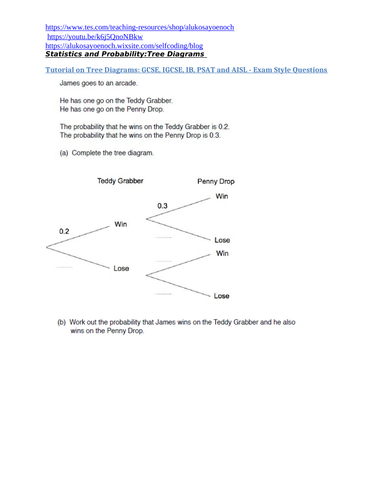
Tree diagrams are a way of showing combinations of two or more events. Each branch is labelled at the end with its outcome and the probability is written alongside the line. Two events are independent if the probability of the first event happening has no impact on the probability of the second event happening.
* GCSE, IGCSE, AP, PSAT, and IB - Exam Style Questions which covers all the related concepts required for students to unravel any International Exam Style Probability and Tree Diagrams Questions
* Learner will be able to say authoritatively that, I can complete any question on:
Listing All Outcomes.
Expected Probability.
The AND / OR Rule.
Tree Diagrams.
Probability from Venn Diagrams.
Something went wrong, please try again later.
This resource hasn't been reviewed yet
To ensure quality for our reviews, only customers who have downloaded this resource can review it
Report this resourceto let us know if it violates our terms and conditions.
Our customer service team will review your report and will be in touch.
£0.00