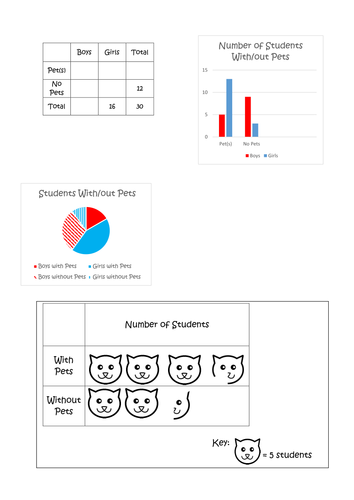


Starter: Tables and charts representing two different data sets to be sorted into piles. Class discussion about the merits of different charts.
Main: Revision PPT to remind students about two-way tables; bar charts; pie charts; pictograms and time-series graphs. Dragon symbol shows it's time to complete the Dragon sheet, Clock symbol shows it's time to complete the time-series sheet.
Plenary: Tweet me something new you've learned.
Main: Revision PPT to remind students about two-way tables; bar charts; pie charts; pictograms and time-series graphs. Dragon symbol shows it's time to complete the Dragon sheet, Clock symbol shows it's time to complete the time-series sheet.
Plenary: Tweet me something new you've learned.
Something went wrong, please try again later.
Report this resourceto let us know if it violates our terms and conditions.
Our customer service team will review your report and will be in touch.
£0.00