
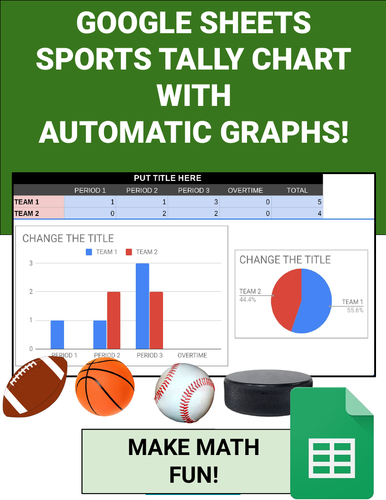
This Google Sheet is setup to create sports tally charts with automatic graphs. It is very easy to use. Students enter their data in the colored cells and the graph is automatically created. The data the students enter is the scores for each quarter, inning and or period based on the sport. This can be done watching a live sport or later looking at a box score. It is a fun way to teach graphs and math!
Included:
4 different sports. One on each tab. These sports include; football, baseball,basketball and hockey
Information page on using tabs.
Information page on using the chart.
Information page on using the graphs.
Students will never lose their data graphs again as this uses Google Drive!
Something went wrong, please try again later.
This resource hasn't been reviewed yet
To ensure quality for our reviews, only customers who have purchased this resource can review it
Report this resourceto let us know if it violates our terms and conditions.
Our customer service team will review your report and will be in touch.
$3.00