


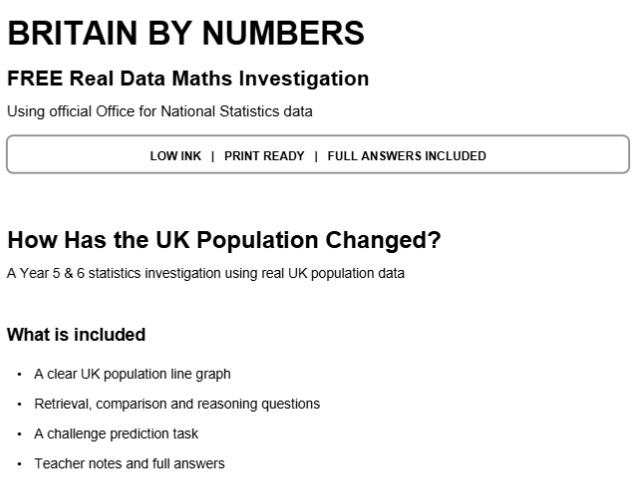
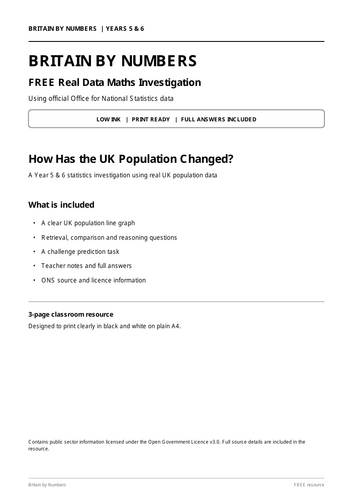
A free Year 5 and 6 statistics investigation using real ONS UK population data, with line graph questions, reasoning, challenge and full answers.
This free Britain by Numbers investigation gives children the chance to work with real UK population data from the Office for National Statistics.
Children use a line graph showing how the UK population changed from 1981 to 2021 and answer carefully sequenced questions involving:
- retrieval
- comparison
- calculating increases
- interpreting trends
- reasoning from data
- recognising how graph scales can affect interpretation
- making a simple prediction
The resource includes: - 2 pupil activity pages
- 1 teacher notes and answers page
- a clear UK population line graph
- full answers
- acceptable answer ranges
- curriculum links
- explanation of rounding and estimates
- ONS source and licence information
- low-ink, print-ready A4 design
Suitable for Year 5 and Year 6 statistics, maths lessons, geography links, morning work, independent practice or assessment-style reasoning.
This resource supports upper KS2 work on line graphs, comparison, sum and difference problems, reasoning and interpreting real data.
A full Britain by Numbers pack with five real-data investigations is also available separately.
Something went wrong, please try again later.
This resource hasn't been reviewed yet
To ensure quality for our reviews, only customers who have downloaded this resource can review it
Report this resourceto let us know if it violates our terms and conditions.
Our customer service team will review your report and will be in touch.
£0.00