
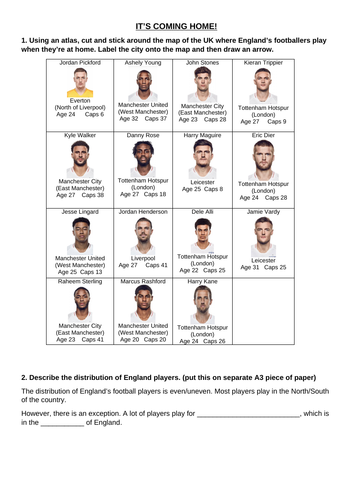
To embrace the World Cup 2018, this document is to get the students to think about where the players in the England team play when they at home but also to improve Geographical skills that can be used later in their education.
There are a series of tasks to get the student to improve how they use an Atlas, then improving statistical skills (mean, median, mode and range), creating bar and scatter graphs and then going back to the Atlas to find out about the teams that were in the quarter-finals of the 2018 World Cup.
This is great for students in Year 7 to 9 and is a great opportunity for a display.
With Year 7-8 students work in pairs, Year 9 are able to this by themselves.
I would really appreciate feedback on this resource as it is the first one I have uploaded. Also I would like to know if people have adapted or included anything else!
Thank you
Something went wrong, please try again later.
This resource hasn't been reviewed yet
To ensure quality for our reviews, only customers who have downloaded this resource can review it
Report this resourceto let us know if it violates our terms and conditions.
Our customer service team will review your report and will be in touch.
£0.00