



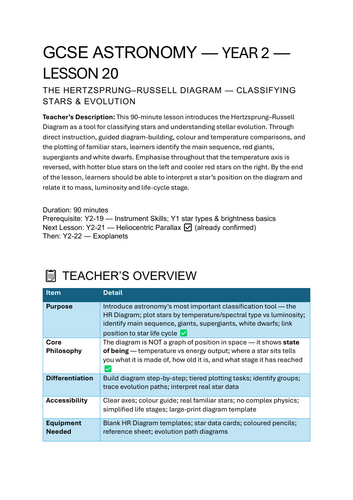
This 90-minute lesson introduces the Hertzsprung–Russell Diagram as a tool for classifying stars and understanding stellar evolution. Through direct instruction, guided diagram-building, colour and temperature comparisons, and the plotting of familiar stars, learners identify the main sequence, red giants, supergiants and white dwarfs. Emphasise throughout that the temperature axis is reversed, with hotter blue stars on the left and cooler red stars on the right. By the end of the lesson, learners should be able to interpret a star’s position on the diagram and relate it to mass, luminosity and life-cycle stage.
Get this resource as part of a bundle and save up to 33%
A bundle is a package of resources grouped together to teach a particular topic, or a series of lessons, in one place.
Something went wrong, please try again later.
This resource hasn't been reviewed yet
To ensure quality for our reviews, only customers who have purchased this resource can review it
Report this resourceto let us know if it violates our terms and conditions.
Our customer service team will review your report and will be in touch.
£3.00