
This activity focuses on tally charts, pictograms and block diagrams.
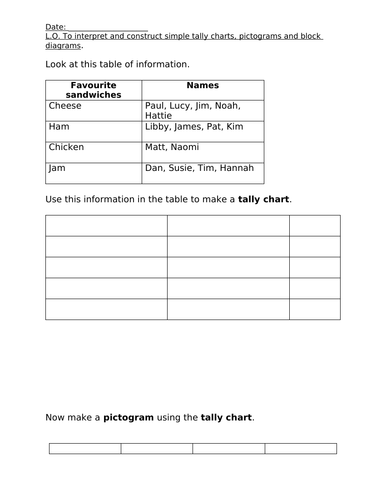
Learning Outcome: To interpret and construct simple tally charts, pictograms and block diagrams.
First they must create a tally chart using the information given, then turn this tally chart into a pictogram. Part of this also requires them to create a key which links a symbol to represent 2 sandwiches.
Next they use the block diagram and tally chart to create a block diagram. Lastly there are some questions that help them to interpret the data.
Something went wrong, please try again later.
This was helpful! Thanks!
Great activity!
Great activity!
Thank you! This is great!
Report this resourceto let us know if it violates our terms and conditions.
Our customer service team will review your report and will be in touch.
£0.00