 Quick View
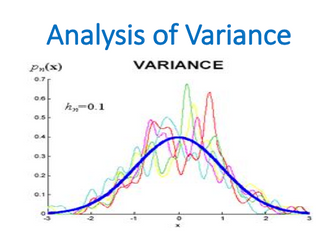
Analysis of Variance (ANOVA) (Statistics)
Analysis of Variance (ANOVA) is a lecture which is covered within the Statistic or Basic Business Statistic module by business and economics students.
Analysis of variance, known by the acronym ANOVA, allows statistical comparison among samples taken from many populations. While ANOVA literally does analyze variation, the purpose of ANOVA is to reach conclusions about possible differences among the means of each group, analogous to the hypothesis tests of the previous chapter. Every ANOVA design uses samples that represent each group and subdivides the total variation observed across all samples (all groups) toward the goal of analyzing possible differences among the means of each group. How this subdivision, called partitioning, works is a function of the design being used, but total variation, represented by the quantity sum of squares total (SST), will always be the starting point. As with other statistical methods, ANOVA requires making assumptions about the populations that the groups represent.
Learning objectives:
The basic concepts of experimental design
How to use one-way analysis of variance to test for differences among the means of several groups
When and how to use a randomized block design
How to use two-way analysis of variance and interpret the interaction effect
How to perform multiple comparisons in a one-way analysis of variance, a randomized block design, and a two-way analysis of variance
In this File you will find:
Analysis of Variance Lecture Power Point Presentation
Test Bank for Analysis of Variance with 213 Questions with all answers to them
61 Exercises for Analysis of Variance lecture / seminar
Plus reading resource on Analysis of Variance in order to enhance you overall knowledge about the topic.
Once you will purchase this resource please leave a comment!
All resources are compressed in zip file.