Starting to collect my stats resources together.
Currently contains a scheme of work, learning journey and 3 lessons. Will add as time goes on. (Only need to purchase once).
This 270 slide Powerpoint covers all of the first year of the single A Level Applied course (based upon the Edexcel course). It includes explanations, worked examples and questions for students to do. I have included everything, possibly more than you may need but I’d rather give people the option to skip a slide than have to make something up on the spot. Colleagues of mine used this during the first year of the new course. The “Forces and Motion” part has been edited and I have got rid of the apostrophe faux pas.
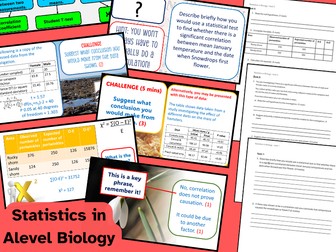
KS5 A level Biology - Statistics.
Support your students to succeed with A level Statistics using this lesson.
The lesson includes application of statistics in a series of scenarios as well as key examiner tips following** extensive analysis of past papers, mark schemes and examiner reports, so your students don’t make the same mistakes as in previous years.
This is a complete lesson ready to use just download, print and go!
Designed for teachers to deliver (specialist and non-specialists) but I have found more & more students need to access resources independently so my lessons are structured in a way that students can navigate for remote learning or to catch up on missed content. Can also be used for a flipped learning approach.
A summary of the lesson contents:
A range of interactive activities, including paired and independent tasks. The PowerPoint includes challenging activities delving into the key points of statistic-based questions, with teacher notes on many slides emphasising the key examiner tips.
Includes:
56 slide PowerPoint
3 worksheets
Detailed answers to all tasks on PowerPoint.
The PowerPoint supports students to revise through a range of fun and interactive tasks to keep students engaged and challenged.
If you are looking for more resources to teach Science check out my shop or click Biological molecules revision
I aim to make my lessons easy to deliver, just click through to each task.
I aim to produce cheap and affordable resources for the price of a good cup of coffee so that you can spend more time doing the things that you want.
If you like these resources, then why not check out my other resources on similar topics in my TES shop.
IB Math AI & HL Unit 4 – Statistics Bundle
Topics: Covers all Topic 4 sub-topics from SL and HL, ranging from data presentation and measures of spread, through correlation, regression, discrete and continuous distributions, to hypothesis testing and parametric models.
Level: IB Mathematics: Applications & Interpretation (SL) and Higher Level (HL)
File Type: Complete editable slide deck bundle
Bundle Price: £40 (save 30 % compared to individual purchase)
Overview
This comprehensive bundle brings together all the slide decks your students need to master the entire Statistics & Probability Unit (Topic 4) of the IB Mathematics AI/HL curriculum. From collecting and describing data, to modelling with binomial, normal and Poisson distributions, and completing full hypothesis tests, each lesson is structured to build conceptual understanding and procedural fluency. The decks seamlessly integrate technology use, exam-style reasoning and real-world applications to prepare learners for both SL and HL assessments.
Learning Outcomes
By the end of the bundle, students will be able to:
Present data using frequency tables, histograms, box-and-whisker plots and cumulative graphs.
Compute and interpret measures of central tendency and spread (mean, median, mode, IQR, standard deviation).
Construct scatter plots, calculate correlation coefficients (Pearson and Spearman) and regression lines, and interpret them in context.
Use discrete models (binomial, Poisson), continuous models (normal), perform standardisation and inverse calculations, and understand expected value and variance.
Understand hypothesis testing frameworks: setting null/alternative hypotheses, using critical regions or p-values, and interpreting Type I and Type II errors.
Design valid data collection methods, choose appropriate categorisations for χ²-tests, and apply technology to compute test statistics.
What’s Included
Fully editable PowerPoint slide decks for every subsection of Unit 4 in the IB Math AI syllabus
Complete walkthroughs for each sub-topic with definitions, animations, worked examples and technology integration.
Real-world case studies and context-rich problems that match IB assessment style.
Instruction on using calculators/software for distributions, inverse calculations and hypothesis tests.
Ti-nspire calculator demos!
Flexible teaching tools suited for SL, HL and mixed-level classes.
Why You’ll Love It
Full coverage of Topic 4: Statistics & Probability, which carries approximately 36 teaching hours at SL and 52 hours at HL. ([Richmond County Schools][2])
Seamless progression from basic data handling to advanced inferential statistics.
Reduction in planning time: everything ready-to-go and fully editable.
Strong alignment with the IB syllabus framework, making classroom delivery and revision structured and coherent.
Excellent value—30 % reduction on individual slide deck pricing, delivering substantial savings for full-unit coverage.
Tags
IB Math AI SL, IB Math AI HL, Unit 4, Statistics, Probability, Descriptive Statistics, Correlation, Regression, Binomial Distribution, Normal Distribution, Hypothesis Testing, Editable Slides, Classroom Resources, IB Curriculum.
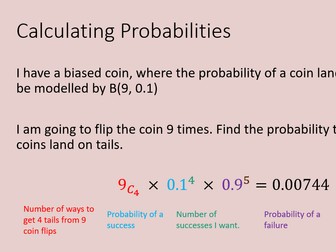
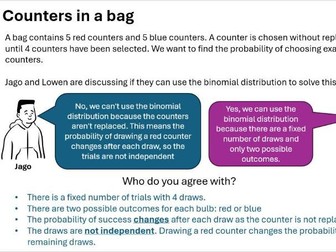
This fully resourced lesson is designed for AQA GCSE Statistics (Higher Tier) and introduces the binomial distribution through engaging dice experiments and a range of visual representations, including tree diagrams, to help students develop a deep conceptual understanding. Students first explore what makes a situation binomial before progressing to calculating binomial probabilities and expected values.
The lesson has been written specifically for the AQA GCSE Statistics specification and deliberately avoids introducing binomial distribution notation (e.g. X~B(n,p) ), combinatorics notation (nCr) and Pascal’s Triangle, as these are not required by AQA. Instead, the focus is on developing understanding through practical contexts, visual models and exam-style questions.
The accompanying worksheets gradually increases in difficulty, beginning with identifying whether a situation can be modelled using a binomial distribution before progressing to calculating probabilities, finding expected values using , and tackling AQA-style questions that require interpretation and statistical reasoning.
Students will learn to:
Recognise the characteristics of a binomial distribution.
Understand the implications of a situation being described as binomial.
Calculate probabilities for a binomial distribution for up to five trials.
Calculate the expected number of successful outcomes using .
This resource includes:
Prior knowledge check question
Investigations with dice to introduce students to the concept of binomial probabilities
Using multiple representations of listing combinations, tree diagrams and bar charts of the distribution.
Card sorting task on whether scenarios are binomial or not.
Progressive worksheet with exam style questions.
Example-problem pairs
AFL strategies such as min-whiteboard questions and ‘Think, Pair, Share’ with teacher guidance in the notes section on the slides.
Exit Ticket Plenary to check students understanding.
Designed specifically for the AQA GCSE Statistics specification, this resource follows the style and level of demand seen in recent examination papers, making it ideal for first teaching, revision or intervention sessions.
These PowerPoints form full lessons of work that together cover the new A level Maths course for all exam boards. Together all the PowerPoints include;
• A complete set of notes for students
• Model examples
• Probing questions to test understanding
• Class questions including answers
• Individual whiteboard work
• Links to exercises in ‘The Textbook by CGP’ these can easily be edited for your textbook
The PowerPoints can be used in the lesson and also given to students that have missed a lesson
I have added ‘A2 level maths 13 - Composite functions’ for free download
Please leave a review as it will really help me to improve my resources
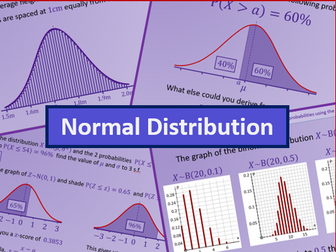
Statistics – Normal distribution covers;
Understand and use the Normal distribution as a model; find probabilities using the Normal distribution
Link to histograms, mean, standard deviation, points of inflection and the binomial distribution
Select an appropriate probability distribution for a context, with appropriate reasoning, including recognising when the binomial or Normal model may not be appropriate
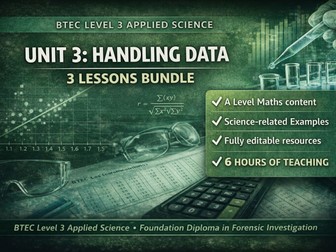
This is a 3 lesson bundle, which covers the A-Level mathematics section in UNIT 3 of the BTEC in Applied Science and the BTEC in Forensic Investigation.
They are comprehensive lessons which are designed to be taught over 2 hours for each one, so 6 hours of teaching in total.
There are starters, plenaries and fully explained example questions included in each lesson.
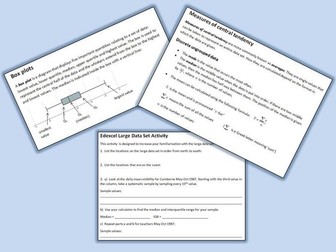
This bundle contains notes and examples for all of the statistics content in year 1 of the new Edexcel Linear Mathematics A Level. Answers are provided to all examples. Also in the bundle are two homework tasks with answers focused on the Edexcel Large Data Set. No specialist software is required for these, only spreadsheet software.
A Short Guide to Statistical Tests. This booklet contains all the information students need for the inferential statistics section of OCR A Level Psychology.
It includes:
How to know which test to use
Levels of measurement (nominal/ordinal/interval)
Significance levels
How to tell if your result is significant (+ a nice easy rule for remembering!)
Binomial sign test instructions
Chi-square instructions
Wilcoxon T instructions
Mann-Whitney U instructions
Spearman’s rho instructions
How to interpret correlations & correlation coefficients
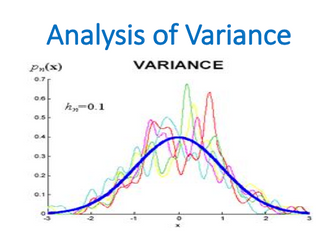
Analysis of Variance (ANOVA) is a lecture which is covered within the Statistic or Basic Business Statistic module by business and economics students.
Analysis of variance, known by the acronym ANOVA, allows statistical comparison among samples taken from many populations. While ANOVA literally does analyze variation, the purpose of ANOVA is to reach conclusions about possible differences among the means of each group, analogous to the hypothesis tests of the previous chapter. Every ANOVA design uses samples that represent each group and subdivides the total variation observed across all samples (all groups) toward the goal of analyzing possible differences among the means of each group. How this subdivision, called partitioning, works is a function of the design being used, but total variation, represented by the quantity sum of squares total (SST), will always be the starting point. As with other statistical methods, ANOVA requires making assumptions about the populations that the groups represent.
Learning objectives:
The basic concepts of experimental design
How to use one-way analysis of variance to test for differences among the means of several groups
When and how to use a randomized block design
How to use two-way analysis of variance and interpret the interaction effect
How to perform multiple comparisons in a one-way analysis of variance, a randomized block design, and a two-way analysis of variance
In this File you will find:
Analysis of Variance Lecture Power Point Presentation
Test Bank for Analysis of Variance with 213 Questions with all answers to them
61 Exercises for Analysis of Variance lecture / seminar
Plus reading resource on Analysis of Variance in order to enhance you overall knowledge about the topic.
Once you will purchase this resource please leave a comment!
All resources are compressed in zip file.
The quiz has 20 questions practising the normal distribution techniques required for Statistics 1 Edexcel including the use of both tables from the formulae book. To use the slideshow when on the table on slide 2 click on the relevant question and the presentation will go to the correct slides for the question and and then answer. It will then return to the table at the beginning. Answers are from the Edexcel formulae book (4 decimal places).
Statistics Maths quiz and answers for KS3 or KS4 Students. Versatile, editable resource for either an Online virtual maths lesson or a more traditional classroom based maths lesson. The topic of the quiz is Statistics
This maths quiz includes a wide variety of different rounds including: matching rounds, photo rounds, linking rounds , number round, multiple choice round , designing round, word search, anagrams and much more…
Contents of Quiz
☞ 1 x Professionally Designed PowerPoint Quiz ( Containing 10 Different Rounds and over 50+ Questions)
☞1 x Set of certificates for winning students (Gold, Silver and Bronze)
☞ 1 x Full set of Answers (Animated at the end of the Quiz)
☞ 1 x Student Answer Sheets they can fill in during the quiz
☞ 1 x FULLY DIGITAL STUDENT ANSWER SHEET
☞ Quiz can be done as an individual task or in small teams.
You may also want to check out some of our popular selling MATHS resources for your students:
✰ Probability - Maths Escape room
✰ End of Term Maths Escape Room
✰ Algebra Escape Room
✰ Different Shapes - Escape Room
✰ Christmas Maths Escape Room
✰ Christmas Maths Bundle
✰ Sequence and Series Math Topic
✰ Numbers - Math Escape room
✰ Data and Statistics - Math Resource
✰ Careers in Maths
✰ Coordinate Geometry Resource
An introduction to statistics for A-level biologists. Takes the student through terms and symbols used, then puts them through several instructions on Microsoft Excel. After this students should be able to describe their data (range, median, standard deviation, etc) but this does not extend to choosing an appropriate statistical test. Takes nearly two hours with plenty of talk around the subject and examples. I recommend you try the exercise beforehand.
 Quick View

 Quick View
 Quick View
 Quick View
 Quick View
 Quick View
 Quick View
 Quick View
 Quick View
 Quick View
 Quick View
 Quick View
 Quick View
 Quick View