This engaging maths resource helps learners develop their understanding of collecting, organising, and representing data using graphs. Ideal for KS1 / KS2 / KS3 depending on differentiation, this pack builds key skills in statistics and interpretation.
Download the complete scheme of work for J836 Cambridge National in IT, R050 Unit 3: Data and Testing. Includes fully editable student workbooks, end of topic test, PowerPoints, and all answers.
This full scheme of work includes:
3.1 Information and data
3.2.1 Use of data types in different contexts
3.2.2-4 Data Verification
3.2.3-4 Data Validation + example Excel file
3.3 Data collection methods + printable scenario cards
3.4 Storage of collected data + printable Top Trump style game cards
3.5 Importance of testing
3.6 Revision and assessment lesson
Revision and assessment lesson includes test paper and mark scheme.
Printable student workbook (PDF and editable Word documents)
Engaging lessons, packed with dual-coding illustrations for your students, with ease of planning and flexibility for you!
All R050 units of work are now available
I used these worksheets with Year 2 and Year 3 classes. Pupils gained experience of using tally marks to collect information and then represent this data in the form of a graph. Depending on pupil abilities, I encouraged them to work individually, with a partner or in a guided group to complete these activities. There are also differentiated versions of some of these activities.
The worksheets included are;
Bag of cubes – used as an easy introduction to data collection and graphing, it requires pupils to be provided with a bag of mixed cubes to systematically tally according to colour and then complete the prepared graph.
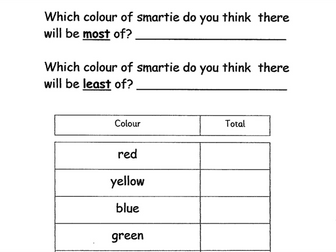
Smarties easy – Always popular and creating great enthusiasm as sweets are involved! Two sheets, largely pre-prepared where pupils in pairs or small groups are given boxes (or 2 tubes) of Smarties, to predict what the most and least colour represented will be before collecting data and completing a graph of results.
Smarties mid – as above but the data collection grid and graph are in a minimal form requiring pupils to fill in the required details.
Smarties top – as above but data collection requires the use and interpretation of tally marks and the graphing sheet is purely a squared grid allowing more able to compile their graph from scratch.
Birthdays – Pupils use tally marks to record the birthdays of their peers (this needs to be done systematically and requires organising to avoid missing anyone or counting people twice!). Once collected they use either 5a. Birthdays Graph filled – a prelabelled graph format sheet or 5b. Birthdays Graph to fill – a basic, unlabelled graph format sheet to compile their graphs.
To learn how to insert bar charts
To develop an understanding of the IF Functions formula.
present information in different graphs i.e. bar graph, bar chart
Topical Past Papers are an essential tool for any student looking to succeed in their exams. These questions are regular past paper questions, but instead of covering all topics, they focus on a specific topic or theme. This allows students to test their knowledge in a more targeted way and identify any areas they may need to improve on. By practicing with Topical Past Papers, students have the opportunity to enhance their understanding of a subject and build their confidence ahead of the exam.
This is the complete module on the topic of organization of data in statistics and economics. It is an exclusive resource where the topics are arranged in a very informative and interesting manner. All the topics are supported by examples and animations. The animated presentation will help you to understand the concept in a very simple and easy way. Each concept is explained with the help of illustrations, images, and outstanding animations. All the concepts are self-explanatory and narrative. This resource will be an added help for your studies nd exam preparations. The presentation is equally important to the students who are studying accountancy and the teachers who instruct the subject.
Total Slides : 47. It's not just a ppt. It's a Complete interactive module with animation and background sound. This will give you an ultimate learning experience for sure.
Contents:
Collection of data
Classification of data
Basis of classification
Variables
Raw data
Statistical Series
Individual series
Continuous series
Frequency Distribution
Types of frequency distribution
Glossary _ Class limits, Frequency, Tally marks, Magnitude etc...
PowerPoint Presentation on Methods of Collecting Data (31 slides): Reviews the data handling cycle and explains the main methods of collecting data and how to avoid bias, as well as how to record and clean data. It has been written by a highly experienced teacher (of 25+ years), senior examiner and reviser for Maths and Stats examinations. It includes:
Lesson objectives
Step-by-step explanations of the subject matter
Examples to aid understanding
Questions to check understanding
Answers to questions, with explanations
Suggestions regarding which topic(s) should be moved on to next.
It is 1 of a set of 5 PowerPoint Presentations on ‘Collecting Data’ that APT Initiatives has published for GCSE Statistics. The content of this PowerPoint is also relevant to the ‘Statistics’ section of the GCSE Maths specifications and included in APT’s PowerPoints for GCSE Maths.
The full set of set of 5 PowerPoints for GCSE Statistics on ‘Collecting Data’ (110 slides excluding Title Pages) covers the following topics:
01 Types of Data (24 slides): Explains the different types of data and how data can be classified according to who collected it.
02 Methods of Collecting Data (31 slides): Reviews the data handling cycle and explains the main methods of collecting data and how to avoid bias, as well as how to record and clean data.
03 Questionnaires and Surveys (30 slides): Explains the dos and don’ts when designing questionnaires or surveys, reviews grouping data, explains random response techniques and what to do with unexpected responses.
04 Sampling and Bias 1 (25 slides): Defines key statistical terms, outlines how to avoid bias, and explains the main methods of sampling.
05 Sampling and Bias 2 (Application) (20 slides): Reviews and applies different sampling techniques and explains the Petersen capture-recapture method.
This set of 5 PowerPoints are one of 4 sets of PowerPoints that APT Initiatives Ltd has published to support teachers and students of GCSE Statistics. Other sets concern:
Representing Data
Analysing Data
Probability
The purchase of this resource comes with a licence to make the resource available in digital and / or in print form (including photocopying) to the staff and students attending the purchasing institution, ie the individual school / college on a single site. The resource may be distributed via a secure virtual learning environment. It must not be made available on any public or insecure website or other platform. The resource must not be distributed to other institutions that are members of the same academy chain or similar organisation; each individual institution must purchase their own copy of the resource.
PowerPoint Presentation on Questionnaires and Surveys (30 slides): Explains the dos and don’ts when designing questionnaires or surveys, reviews grouping data, explains random response techniques and what to do with unexpected responses. It has been written by a highly experienced teacher (of 25+ years), senior examiner and reviser for Maths and Stats examinations. It includes:
Lesson objectives
Step-by-step explanations of the subject matter
Examples to aid understanding
Questions to check understanding
Answers to questions, with explanations
Suggestions regarding which topic(s) should be moved on to next.
It is 1 of a set of 5 PowerPoint Presentations on ‘Collecting Data’ that APT Initiatives has published for GCSE Statistics. The content of this PowerPoint is also relevant to the ‘Statistics’ section of the GCSE Maths specifications and included in APT’s PowerPoints for GCSE Maths.
The full set of set of 5 PowerPoints for GCSE Statistics on ‘Collecting Data’ (110 slides excluding Title Pages) covers the following topics:
01 Types of Data (24 slides): Explains the different types of data and how data can be classified according to who collected it.
02 Methods of Collecting Data (31 slides): Reviews the data handling cycle and explains the main methods of collecting data and how to avoid bias, as well as how to record and clean data.
03 Questionnaires and Surveys (30 slides): Explains the dos and don’ts when designing questionnaires or surveys, reviews grouping data, explains random response techniques and what to do with unexpected responses.
04 Sampling and Bias 1 (25 slides): Defines key statistical terms, outlines how to avoid bias, and explains the main methods of sampling.
05 Sampling and Bias 2 (Application) (20 slides): Reviews and applies different sampling techniques and explains the Petersen capture-recapture method.
This set of 5 PowerPoints are one of 4 sets of PowerPoints that APT Initiatives Ltd has published to support teachers and students of GCSE Statistics. Other sets concern:
Representing Data
Analysing Data
Probability
The purchase of this resource comes with a licence to make the resource available in digital and / or in print form (including photocopying) to the staff and students attending the purchasing institution, ie the individual school / college on a single site. The resource may be distributed via a secure virtual learning environment. It must not be made available on any public or insecure website or other platform. The resource must not be distributed to other institutions that are members of the same academy chain or similar organisation; each individual institution must purchase their own copy of the resource.
Editable Revision Guide for KS3 Maths to Improve Independent Learning of the Data Handling Cycle.
Content Includes: Population and Sample Definitions, Sampling Size, Reducing Bias in a Sample, Random Sampling, Primary and Secondary Data, Discrete and Continuous Data, Data Collection Sheets, Questionnaires, Presenting and Analyzing Data.
PowerPoint Presentation on Types of Data (24 slides): Explains the different types of data and how data can be classified according to who collected it. It has been written by a highly experienced teacher (of 25+ years), senior examiner and reviser for Maths and Stats examinations. It includes:
Lesson objectives
Step-by-step explanations of the subject matter
Examples to aid understanding
Questions to check understanding
Answers to questions, with explanations
Suggestions regarding which topic(s) should be moved on to next.
It is 1 of a set of 5 PowerPoint Presentations on ‘Collecting Data’ that APT Initiatives has published for GCSE Statistics. The content of this PowerPoint is also relevant to the ‘Statistics’ section of the GCSE Maths specifications and included in APT’s PowerPoints for GCSE Maths.
The full set of set of 5 PowerPoints for GCSE Statistics on ‘Collecting Data’ (110 slides excluding Title Pages) covers the following topics:
01 Types of Data (24 slides): Explains the different types of data and how data can be classified according to who collected it.
02 Methods of Collecting Data (31 slides): Reviews the data handling cycle and explains the main methods of collecting data and how to avoid bias, as well as how to record and clean data.
03 Questionnaires and Surveys (30 slides): Explains the dos and don’ts when designing questionnaires or surveys, reviews grouping data, explains random response techniques and what to do with unexpected responses.
04 Sampling and Bias 1 (25 slides): Defines key statistical terms, outlines how to avoid bias, and explains the main methods of sampling.
05 Sampling and Bias 2 (Application) (20 slides): Reviews and applies different sampling techniques and explains the Petersen capture-recapture method.
This set of 5 PowerPoints are one of 4 sets of PowerPoints that APT Initiatives Ltd has published to support teachers and students of GCSE Statistics. Other sets concern:
Representing Data
Analysing Data
Probability
The purchase of this resource comes with a licence to make the resource available in digital and / or in print form (including photocopying) to the staff and students attending the purchasing institution, ie the individual school / college on a single site. The resource may be distributed via a secure virtual learning environment. It must not be made available on any public or insecure website or other platform. The resource must not be distributed to other institutions that are members of the same academy chain or similar organisation; each individual institution must purchase their own copy of the resource.
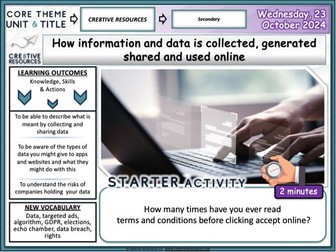
Data + Information Is generated, collected, shared | Online Safety . A fully-resourced editable PSHE PowerPoint lesson (1 hour +) which can be used by teachers to deliver a detailed workshop / session /lesson on the importance of this topic.
This is a topic that comes up under the new PSHE Statutory Guidance for RSHE.
Learning Outcomes:
To be able to describe what is meant by collecting and sharing data To be aware of the types of data you might give to apps and websites and what they might do with this To understand the risks of companies holding your data
Key terms
Data, targeted ads, algorithm, GDPR, elections, echo chamber, data breach, rights
Each Lesson Pack Contains:
1 Fully Editable Careers PowerPoint (Learning Outcomes, Confidence Checkers, Assessment of Learning, Variety of Tasks, Video Embedded URL Clips, Engaging Premium Quality Slides, Extra Support Websites, Challenging & Thoughtful Questioning)
Assessment Opportunity (Confidence Checker)
The lesson includes a detailed PowerPoint, variety of student facing tasks and comprehension tasks These resources have been designed to be engaging, informative and pick up and teach.
Why not check out some of our latest super bundles below:
Young Adults and Choices
Online Safety + Staying Safe
Personal Safety Unit
Equality & Protected Characteristics
British Values Explored Bundle
Society, Body Image + Peer Pressure
Diversity & Equality
If you need any support with this lesson or would like to find out more about the FULL PSHE Currriculum email: thecre8tiveresources@gmail.com or google “Cre8tive resources”
I have fully completed and gone over the Digital Information Technology COMPONENT 2: Collecting, Presenting and Interpreting Data Pearson Set Assignment June 2026.
This is a great guide to help you complete the new released June 2026 paper.
Great tool to assist the marking process so you can check and cross reference against the provided answers.
Included is a fully completed Excel Spreadsheet with all completed tasks for 2A 2B and 2C as well as a complete ‘how to guide’ on PowerPoint.
Fully completed examplar answers for task 3 errors patterns and trends, as well as a guide on responding well to task 1, task 1 is generic and can be used on any PSA, not just the June 2026.
Fully completed suggested answer Task 1, Task 2ABC, and Task 3 from the current specification. (not to be shared with students).
06/1/2026 - added a task to help students with task 2C - this task uses generic data, not the PSA data and can be shared with the students. This will guide students on how to create tables, charts and sparklines.
06/1/2026 - added a new Slide on the PowerPoint guide for Tables, Sparklines and Line Graphs in the answers section.
Also updated the completed Spreadsheet with this included.
PowerPoint Presentation on Collecting Data (31 slides): Reviews the data handling cycle and explains the main methods of collecting data and how to avoid bias, as well as how to record and clean data. It has been written by a highly experienced teacher (of 25+ years), senior examiner and reviser for Maths and Stats examinations. It includes:
Lesson objectives
Step-by-step explanations of the subject matter
Examples to aid understanding
Questions to check understanding
Answers to questions, with explanations
Suggestions regarding which topic(s) should be moved on to next.
This is 1 of a set of 14 PowerPoints on ‘Collecting and Presenting Data’ that APT Initiatives has published for GCSE (and Key Stage 3) Mathematics. The full set of 14 PowerPoints (299 slides, excluding Title Pages) covers the following topics relating to 'Collecting and Presenting Data’:
01 Types of Data (24 slides).
02 Collecting Data (31 slides).
03 Questionnaires and Surveys (30 slides).
04 Sampling and Bias (25 slides).
05 Block Diagrams and Dot Plots (12 slides).
06 Pictograms (16 slides).
07 Bar Charts, Bar Line Graphs and Frequency Diagrams – Polygons (26 slides).
08 Line Graphs (9 slides).
09 Stepped Tables and Two-way Tables (18 slides).
10 Pie Charts (18 slides).
11 Scatter Diagrams (40 slides).
12 Stem and Leaf Diagrams (17 slides).
13 Histograms (14 slides).
14 Misleading Graphs and other Data Representations (19 slides).
These PowerPoints relate to the ‘Statistics’ sections of the Maths specifications. Other sets relating to Statistics concern: Analysing Data.
Note: Work on frequency tables, cumulative frequency tables and graphs, box (and whisker) plots and time series is included in APT’s set of PowerPoints on ‘Analysing Data’. Work on conversion graphs and distance-time graphs is included in APT’s set of PowerPoints on ‘Graphs’. There are also additional PowerPoints available that cover the additional GCSE Statistics parts of this module of statistical work – covering sampling in more depth, comparative pie charts, population pyramids and choropleths.
The purchase of this resource comes with a licence to make the resource available in digital and / or in print form (including photocopying) to the staff and students attending the purchasing institution, ie the individual school / college on a single site. The resource may be distributed via a secure virtual learning environment. It must not be made available on any public or insecure website or other platform. The resource must not be distributed to other institutions that are members of the same academy chain or similar organisation; each individual institution must purchase their own copy of the resource.
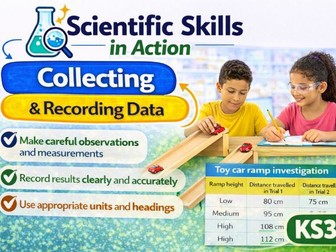
Help students develop the practical skills needed to collect and organise scientific data accurately.
This Investigate Like a Scientist bundle develops students’ ability to collect, record, and organise scientific data, an essential skill for carrying out meaningful investigations.
Designed for KS3 students (Years 7-8), these lessons help students understand how scientists gather observations, measure results, and organise data so it can be analysed effectively.
Students learn how to:
• Make careful observations and measurements during investigations
• Record results clearly and accurately in tables or structured formats
• Use appropriate units and headings when collecting data
• Organise results so they can be analysed and interpreted later
Through structured examples and scaffolded practice, students begin to understand that accurate data collection is essential for drawing reliable scientific conclusions.
What’s Included
This bundle provides complete ready-to-teach resources designed to make teaching scientific investigation skills clear and effective:
• Teacher Guide: clear explanation of data collection and recording methods with teaching notes and questioning prompts
• Classroom Slides: structured lessons that demonstrate how scientists record data during investigations
• Student Notes & Worksheets: scaffolded tasks that help students practise recording results using tables and structured formats
• Additional Resources: investigation scenarios and visual examples to support deeper scientific thinking
Why Teachers Love It
Ready-to-teach lessons that save valuable planning time
Designed so non-specialist teachers can confidently teach practical investigation skills
Develops essential Working Scientifically skills used across KS3 science
Builds the data-handling skills students need for science investigations
As part of the Investigate Like a Scientist program, these classroom slides are most powerful when used with the matching posters and the experiment/investigation workbook. The posters and teaching slides provide the explicit instruction, while the workbook allows students to apply the skill sequence in a structured and professional format.
This clear, detailed and visually-appealing resource offers a complete reference point for Year 4 children, teachers and parents covering knowledge relating to ‘Data and Information’ as a part of their computing learning.
The organiser has a particular focus on introducing children to data logging, including using data loggers to collect, log and interpret data. It contains comprehensive sections on:
-Overview;
-Data Collection;
-Data Recording;
-Analysing Data;
-Answering Questions;
-Key Vocabulary.
The content is fully aligned with the age-related expectations for Year 4 children in computing. The resource is designed to be printed onto A3, and is provided as both a PDF and a Word version (so that you can edit if you want to). All images used are licensed for commercial use and are cited on a separate document (included).
I have fully completed and gone over the Digital Information Technology COMPONENT 2: Collecting, Presenting and Interpreting Data Pearson Set Assignment Jan 2027.
This is a great guide to help you complete the new released Jan 2027 paper.
Great tool to assist the marking process so you can check and cross reference against the provided answers.
Included is a fully completed Excel Spreadsheet with all completed tasks for 2A 2B and 2C as well as a complete ‘how to guide’ on PowerPoint. Additonal slides on the PowerPoint guide for Tables, Sparklines and Line Graphs in the answers section.
Also updated the completed Spreadsheet with this included.
Fully completed examplar answers for task 3 errors patterns and trends, as well as a guide on responding well to task 1, task 1 is generic and can be used on any PSA, not just the Jan 2027.
Fully completed suggested answer Task 1, Task 2ABC, and Task 3 from the current specification. (not to be shared with students).
A bonus task to help students with task 2C - this task uses generic data, not the PSA data and can be shared with the students. This will guide students on how to create tables, charts and sparklines.
Help students learn how scientists collect observations and record results clearly during an investigation.
This ready-to-teach resource is part of the Investigate Like a Scientist series, designed to explicitly teach the scientific skills students need to investigate the world around them and communicate their findings.
In many investigations, students carry out experiments but struggle to record their results clearly or consistently. This lesson helps students understand how scientists collect and organise information so that results can be interpreted and shared.
Students learn how to:
Observe carefully during an investigation
Record results clearly and accurately
Use simple tables, charts, or drawings to organize information
Understand why scientists record data using the same method each time
Rather than expecting students to develop these skills informally, this resource explicitly teaches the process step-by-step, using clear examples appropriate for KS 2 learners.
Ideal for Years 3-4 classrooms and suitable for non-specialist teachers, this lesson helps students build confidence in recording scientific observations and results.
What’s Included
This bundle contains a complete classroom package to teach the skill Collecting and Recording Data.
Teacher Guide
A clear overview explaining what data collection is and why it is important in science investigations. Includes teaching guidance, worked examples, and optional sentence starters to support student thinking.
Classroom Slide Deck
A ready-to-use PowerPoint lesson introducing students to how scientists collect observations and record results during an investigation.
Student Notes
Student-friendly explanations and examples showing how to record data using simple tables, charts, and labelled observations.
Additional Teaching Resources
Extra examples and activities that allow students to practise collecting and recording results during investigations.
Why Teachers Love This Resource
Fully ready-to-teach science lessons
Ideal for busy teachers and non-specialist science teachers
Develops key Working Scientifically skills
Helps students organise results clearly
Can be applied to any science topic
As part of the Investigate Like a Scientist program, these classroom slides are most powerful when used with the matching posters and the experiment/investigation workbook. The posters and teaching slides provide the explicit instruction, while the workbook allows students to apply the skill sequence in a structured and professional format.