 Quick View
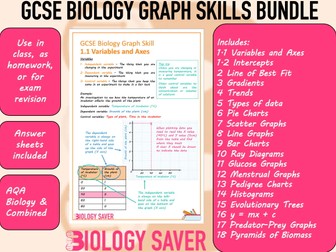
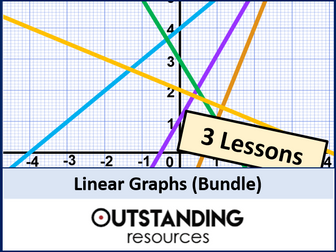
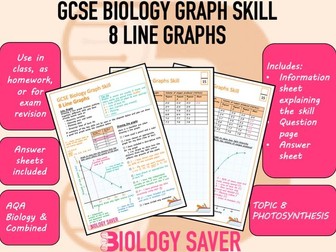
GCSE Biology Graph Skill - 8 Line Graphs
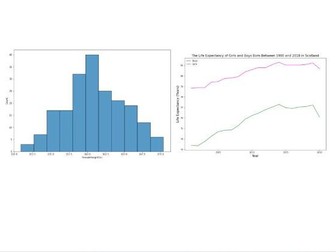
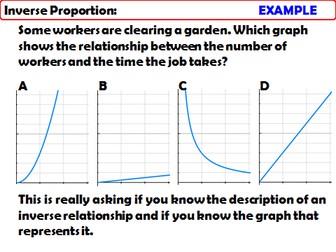
This resource covers a key graph skill for GCSE Biology. The skill covered is Line Graphs which can be taught in Topic 8 Photosynthesis.
Included:
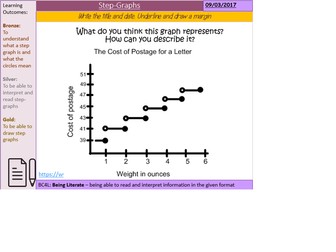
Graph skills summary checklist
Information page explaining the Graph skill
Worksheet of questions
Answer sheet
This resource can be printed as a double sided A4 sheet perfect for in class activity or a homework. Recommended for year 9/10 to learn the skill during the topic or for year 11 as recap of skills as exam preparation.
Skill is required for AQA GCSE Biology and Combined Science. Skill is also applicable in other exam boards such as Edexcel and OCR.
All 8 Photosynthesis revision resources are found in a bundle here:
https://www.tes.com/teaching-resource/gcse-topic-bundle-8-photosynthesis-13228715
There is a bundle containing all graph skills here:
https://www.tes.com/teaching-resource/gcse-biology-graph-skills-bundle-13105264
All individual Biology Graph skills for GCSE Biology can be found below:
1.1 Variables and Axes
1.2 Intercepts
2 Line of Best Fit
3 Gradients
4 Trends
5 Types of Data
6 Pie Charts
7 Scatter Graphs
8 Line Graphs
9 Bar Charts
10 Ray Diagrams
11 Glucose Graphs
12 Menstrual Graphs
13 Pedigree Charts
14 Histograms
15 Evolutionary Trees
16 y = mx + c
17 Predator-Prey Graph
18 Pyramids of Biomass