International
Resources
Topical and themed
Pre-K and Kindergarten
Elementary
Middle school
High school
Special education
Education Jobs
Schools directory
News
Courses
Store
Resources
Education Jobs
Schools directory
News
Search
Tes for schools
Log in
Register
for free
Resources
Education Jobs
Schools directory
News
Magazine
Courses
Log out
Help
Home feed
My list
Courses
My Jobs
Job alerts
My CV
Career preferences
Resources
Author dashboard
Settings
Edit account
Log out
Home
Resources
Jobs
Schools directory
News
Magazine
Courses
Register for free
Log in
Help
Dlambton's Shop
Add a resource
Edit shop
Average Rating
4.24
(based on 17 reviews)
Dlambton's Shop
Average Rating
4.24
(based on 17 reviews)
Maths resources to KS5
Edit shop
Add a resource
26
Uploads
13k+
Views
2k+
Downloads
More about
this author
Less about
this author
Maths resources to KS5
All resources
Relevance
Relevance
Newest
Highest rated
Lowest price
dlambton
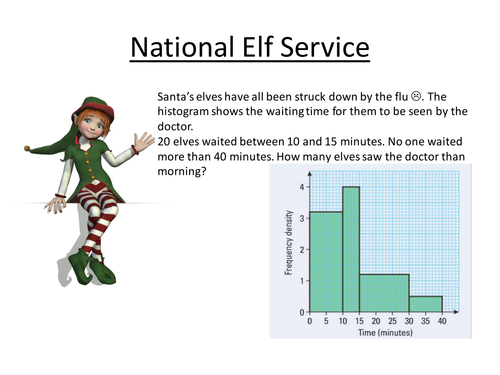
Christmas Data Handling Activities
(0)
dlambton
Treasure Hunt - Constructions
(0)
dlambton
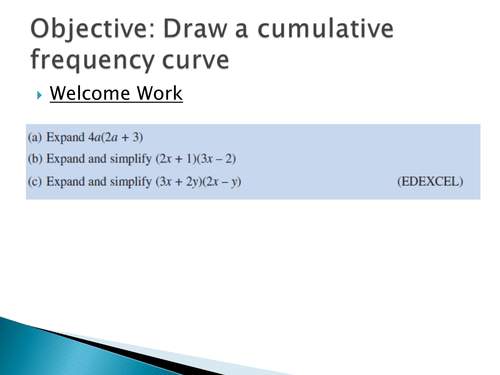
Cumulative Frequency Graphs
(0)
dlambton
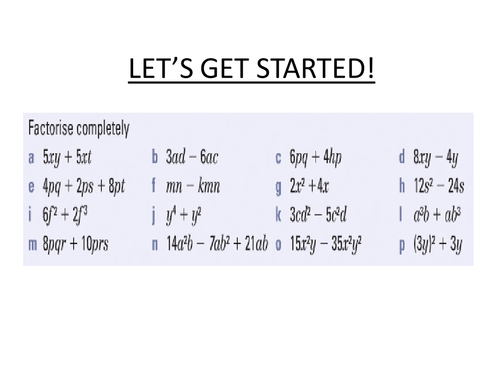
Factorising linear and quadratic expressions
(0)
dlambton
Introduction to Standard Deviation
(0)
dlambton
Experimental Probability Horse Race
(0)
dlambton
Finding the nth term of a linear sequence
(0)
dlambton
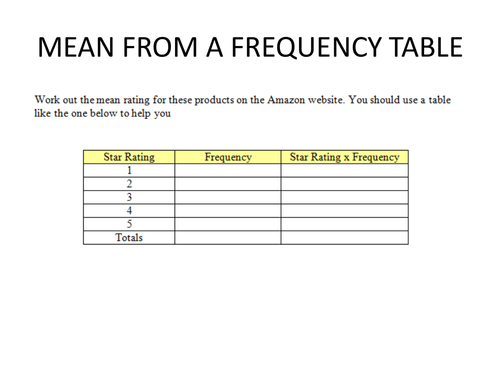
Mean from Frequency Tables
(1)
dlambton
Expanding Two Brackets
(1)
Bundle
dlambton
Data Handling Resource Bundle
6 Resources
dlambton
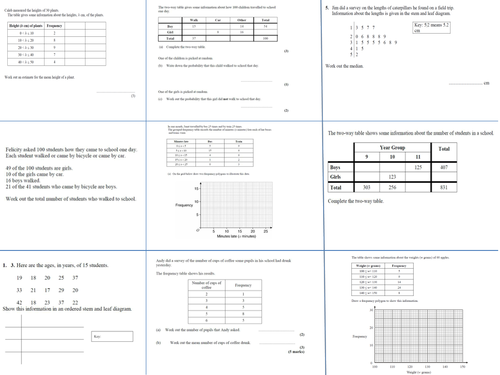
Data Handling Exam Questions
(0)
dlambton
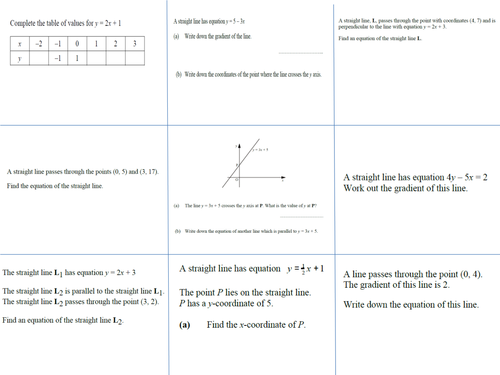
Straight Line Graphs GCSE Exam Questions
(0)
dlambton
Gradient of a line and other graphs
(0)
dlambton
REVISION QUESTIONS FOR HIGHER GCSE
(1)
dlambton
Connected Objects (M1)
(0)
dlambton
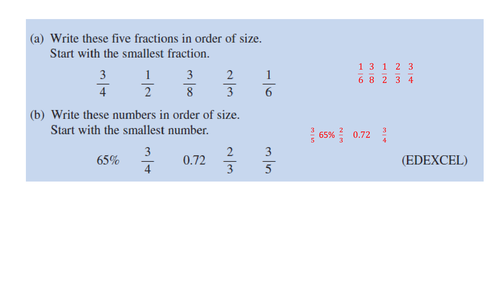
Using the Four Operations with Fractions
(0)
Bundle
dlambton
REVISION BUNDLE
5 Resources
dlambton
REVISION QUESTIONS FOR FOUNDATION GCSE
(0)
dlambton
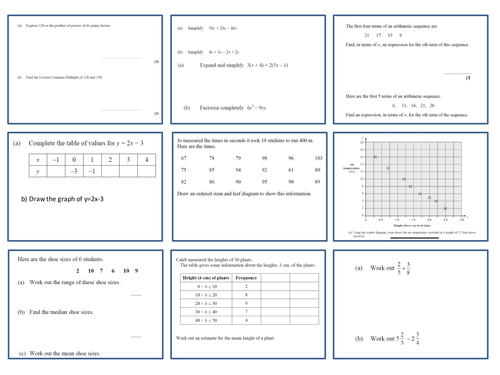
GCSE Revision Starter Questions
(0)
dlambton
Simultaneous Eqns
(0)
Previous
1
2
Next