Within this document you will find a mild (single chilli), hot, spicy and extra spicy challenge. This is for teaching statistics to year four (but can be adapted). I have used some mastery level challenges within also.
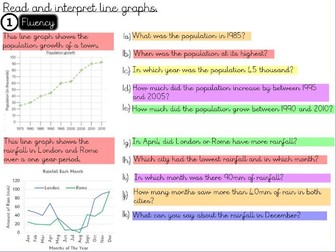
This is a whole lesson based on the Year 5 Statistics objective of " Read and interpret line graphs ”. This resource includes the teacher input ( learning journey), independent worksheet and a depth activity to deepen the children’s understanding of the concept being learned.
The questions have been inspired and adapted from the White Rose Small Steps Guidance and Teaching for Mastery documents. This document is useful for teachers who have adapted Maths Mastery and need guidance in the approach or those who are looking for variation in fluency, reasoning and problem solving or simply those who don’t want to plan it themselves but want high quality resources and quality first teaching. =)
All of the documents that are uploaded as an Activinspire file are interactive and all of the concrete/pictorial manipulative can be used, moved and manipulated.
This document can be downloaded on Activinspire and it is also available as a PDF for those who do not have Activinspire.
Please note - these resources are not compatible with Smart Notebook and the PDF file is not interactive.
Thank you for taking the time to review my resources. =)
I hope this helps you with your teaching and if it does please could you be kind enough to leave some positive feedback. =)
Kind regards,
@MasteryMaths01
This is a whole lesson based on the Year 5 Statistics objective of " Draw line graphs”. This resource includes the teacher input ( learning journey), independent worksheet and a depth activity to deepen the children’s understanding of the concept being learned.
The questions have been inspired and adapted from the White Rose Small Steps Guidance and Teaching for Mastery documents. This document is useful for teachers who have adapted Maths Mastery and need guidance in the approach or those who are looking for variation in fluency, reasoning and problem solving or simply those who don’t want to plan it themselves but want high quality resources and quality first teaching. =)
All of the documents that are uploaded as an Activinspire file are interactive and all of the concrete/pictorial manipulative can be used, moved and manipulated.
This document can be downloaded on Activinspire and it is also available as a PDF for those who do not have Activinspire.
Please note - these resources are not compatible with Smart Notebook and the PDF file is not interactive.
Thank you for taking the time to review my resources. =)
I hope this helps you with your teaching and if it does please could you be kind enough to leave some positive feedback. =)
Kind regards,
@MasteryMaths01
Limited time only this special price for over £30 pounds worth of resources a SPECIAL PRICE.
The Great ALL Statistics Bundle filled with worksheets and answers, lesson presentation engaging and interactive.
Great for whole lesson or quick fire revision.
11 Resources, Over 15 Lessons worth of resources.
Contains GREAT Animated Graphics / tools to make that teaching easier. Ideal for revision or for whole lessons, very well planned and in detail so ideal for either mode.
Data Handling Lessons. Enjoy!
Ideal for GCSE 9-1 exam practice
Ideal for GCSE revision
Short lesson support based on statistics. Lessons suitable for entry 1-3 learners. Powerpoints are support for lessons and not actual lessons. These can be interpreted however the individual using them sees fit.
18 mixed resources allowing teacher’s to choose the most appropriate resources for their pupil’s needs and abilities.
Read and Draw Pictograms A-C
Read and Draw Bar Charts A-F
Read Tables A-C
Bar Chart and Pictogram Problem Solving A-F
This is a whole lesson based on the Year 5 Statistics objective of “Timetables”. This resource includes the teacher input ( learning journey), independent worksheet and a depth activity to deepen the children’s understanding of the concept being learned.
The questions have been inspired and adapted from the White Rose Small Steps Guidance and Teaching for Mastery documents. This document is useful for teachers who have adapted Maths Mastery and need guidance in the approach or those who are looking for variation in fluency, reasoning and problem solving or simply those who don’t want to plan it themselves but want high quality resources and quality first teaching. =)
All of the documents that are uploaded as an Activinspire file are interactive and all of the concrete/pictorial manipulative can be used, moved and manipulated.
This document can be downloaded on Activinspire and it is also available as a PDF for those who do not have Activinspire.
Please note - these resources are not compatible with Smart Notebook and the PDF file is not interactive.
Thank you for taking the time to review my resources. =)
I hope this helps you with your teaching and if it does please could you be kind enough to leave some positive feedback. =)
Kind regards,
@MasteryMaths01
Read less
This set of worksheets is intended for practice in drawing line graphs based on data given in tables. They follow on from lesson 4 in a lesson sequence available on TES. Some interpretation questions are also included.
Differentiated:
3 dots = higher ability, 2 dots = middle ability, 1 dot = lower ability
Download the 4 lesson sequence these worksheets correspond with via the link:
https://www.tes.com/teaching-resource/data-4-lesson-smart-notebook-slides-tables-two-way-tables-line-graphs-ks2-11995417?theme=4
For other worksheets from this series, follow these links:
Simple Tables - https://www.tes.com/teaching-resource/simple-data-table-differentiated-worksheets-ks2-statistics-11995451
Two-way Tables - https://www.tes.com/teaching-resource/two-way-tables-differentiated-worksheets-data-statistics-ks2-11995458
Interpreting Line Graphs - https://www.tes.com/teaching-resource/interpreting-line-graphs-differentiated-worksheets-ks2-11995467
I have compiled a selection of fluency, reasoning and problem solving activities designed as an end of block assessment piece. Covers tally charts, pictograms and block diagrams and has been differentiated 3 ways. Inspired by WRM.
Brought to you by Tes in partnership with experts at Mathematics Mastery and the White Rose Maths Hub, this PDF provides teachers with the progression of learning for the topic, broken down into digestible chapters.
It is an ideal starting point for primary teachers looking to brush up on their subject knowledge, or adopt the mastery approach to maths in their classroom.
Check out the Teaching for mastery site, which contains schemes of work accompanied by quality-assured classroom resources.
Download resources to match this topic in the planning and lesson resources pages of the new primary maths section.
Year 2 Statistics Bundle
This year 2 maths teaching bundle contains the following 4 PowerPoint presentations and activities with accompanying worksheets:
Tally Charts - Year 2
Pictograms - Year 2
Block Diagrams - Year 2
Tables - Year 2
Each of these maths teaching resources has been designed to help deliver lessons covering the curriculum objectives of the year 2 maths programme of study (Statistics).
This bundle gives you a saving of 33% when compared to buying each resource individually.
NEW for 2019/20
White Rose Maths is pleased to announce its premium purposeful practice resources. These resources are available for one off purchase through the TES or as part of individual and school subscription packages on our own site https://resources.whiterosemaths.com
These one off purchases are aimed at schools who just want particular one off resources to teach particular areas of the curriculum.
These resources are for Year 2 – Statistics – 6 small steps
Included is the following for each step of the White Rose Maths curriculum
A 2 page write on purposeful practice worksheet
A display version of the same worksheet. This also can be used as a non-write on version.
PowerPoint which contains each of the questions from the worksheets, one slide per question. Ideal for whole class display and discussion.
All the answers to all the problems.
This is a whole lesson based on the Year 5 Statistics objective of " Use line graphs to solve problems ”. This resource includes the teacher input ( learning journey), independent worksheet and a depth activity to deepen the children’s understanding of the concept being learned.
The questions have been inspired and adapted from the White Rose Small Steps Guidance and Teaching for Mastery documents. This document is useful for teachers who have adapted Maths Mastery and need guidance in the approach or those who are looking for variation in fluency, reasoning and problem solving or simply those who don’t want to plan it themselves but want high quality resources and quality first teaching. =)
All of the documents that are uploaded as an Activinspire file are interactive and all of the concrete/pictorial manipulative can be used, moved and manipulated.
This document can be downloaded on Activinspire and it is also available as a PDF for those who do not have Activinspire.
Please note - these resources are not compatible with Smart Notebook and the PDF file is not interactive.
Thank you for taking the time to review my resources. =)
I hope this helps you with your teaching and if it does please could you be kind enough to leave some positive feedback. =)
Kind regards,
@MasteryMaths01
A set of differentiated worksheets for interpreting line graphs. These worksheets follow lesson 3 of a series on data. Each worksheet has questions related to specific line graphs, progressively more difficult to interpret, and each comes with answers.
Differentiated:
3 dots = higher ability, 2 dots = middle ability, 1 dot = lower ability
Download the 4 lesson sequence this set corresponds with by following the link:
https://www.tes.com/teaching-resource/data-4-lesson-smart-notebook-slides-tables-two-way-tables-line-graphs-ks2-11995417
For other worksheets in this series:
Simple Data Tables - https://www.tes.com/teaching-resource/simple-data-table-differentiated-worksheets-data-statistics-ks2-11995451
Two-way Tables - https://www.tes.com/teaching-resource/two-way-tables-differentiated-worksheets-data-statistics-ks2-11995458
Drawing Line Graphs - https://www.tes.com/teaching-resource/drawing-line-graphs-differentiated-worksheets-data-statistics-ks2-11995477
This is a COMPLETE resource pack (up to 7 lessons) for teaching all Year 5 Statistics objectives. Included is differentiated worksheets (19 pages) to teach line graphs and tables including timetables (in Word and PDF format - the Word versions can of course be edited if necessary) and answer sheets. In addition there is a 30 page flipchart (ActivInspire, PowerPoint and PDF format) to help deliver and teach the lessons. Also included is a planning tool, so you’ll simply need to copy and paste plans into your desired format. Statistics resources are hard to find, especially differentiated, with flipcharts and planning, and this resource will save you the many hours/days of planning, resourcing etc.
Objectives covered:
Solve comparison, sum and difference problems using information presented in a line graph
Complete, read and interpret information in tables, including timetables
Check out my shop to find lots of other fantastic maths resources!
Visit My Shop!
More like this…
Coordinates and Translations
Year 5 Maths and Science Assessments
Equivalent Fractions
Year 2 statistic assessment covering:
• Identifying block graphs, tally charts and pictograms
• Constructing block graphs, tally charts and pictograms
• Answering questions on block graphs, tally charts and pictograms
• Asking questions on block graphs, tally charts and pictograms
For this assessment the score is out of 16 and is a great way to track where your children are and see what if any invention the children need to help them become more secure with statistics.
This is the bundle of all my very popular KS2 Statistics resources at a discounted price. Also included for free, are my statistics assessments! Save yourself hours and hours of work with this fantastic bargain!
This series of resources has been designed for use by tutors doing 1:1 or small group work. They can also be used by class teachers when consolidating or mastering an objective. Some of them contain resources found on Twinkl – these are obviously not included.
 Quick View
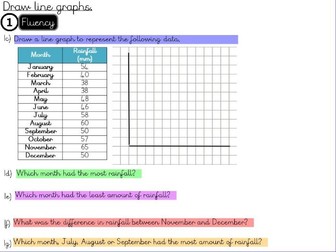 Quick View
 Quick View
 Quick View
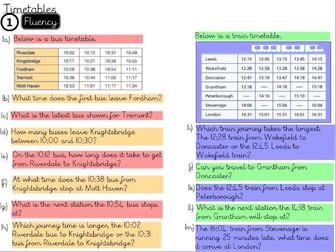 Quick View
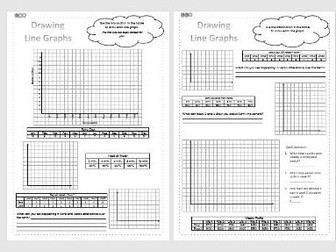 Quick View
 Quick View
 Quick View
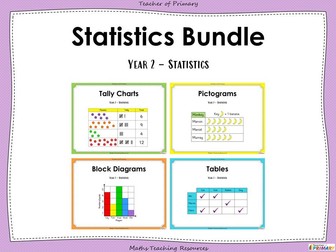 Quick View
 Quick View
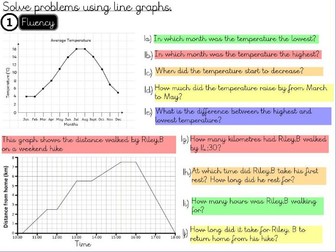 Quick View
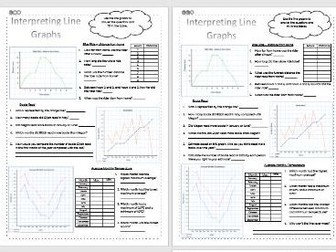 Quick View
 Quick View
 Quick View