World Energy & Electricity Data Pack: 80 Countries, 500 Power Plants + 10 Lessons with AnswersQuick View
LilambdCrossing

World Energy & Electricity Data Pack: 80 Countries, 500 Power Plants + 10 Lessons with Answers

(0)
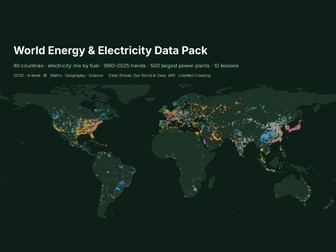
Real electricity data for maths, geography and science lessons. Countries: 80 countries in 2024, electricity mix by fuel (coal, gas, oil, nuclear, hydro, wind, solar, bioenergy), renewables and fossil share, carbon intensity, electricity per person, GDP per person TimeSeries: World plus 15 countries, 1990-2025 (renewables, fossil, solar, wind, carbon intensity) PowerPlants: the 500 largest power plants with fuel, capacity, opening year and location 10 ready tasks with worked answers: pie charts, mean vs median, quartiles, Spearman’s rank, PMCC, percentage growth, line graphs, mapping, data-based debate Charts: world map of the largest plants, renewables trend, carbon vs renewables Data: Ember and Our World in Data (CC BY 4.0), WRI Global Power Plant Database (CC BY 4.0), World Bank (CC BY 4.0), UN WPP (CC BY 3.0 IGO), Natural Earth (public domain). Licence: use with your own classes; please do not resell. Built with our own code from public data; the lesson tasks were drafted with AI help and every answer was computed from the data. Custom data packs, maps or worksheets for your class: hello@lilambd.com
Tectonic Hazards Data Pack: Real Quake, Volcano and Tsunami Data + 10 LessonsQuick View
LilambdCrossing

Tectonic Hazards Data Pack: Real Quake, Volcano and Tsunami Data + 10 Lessons

(0)
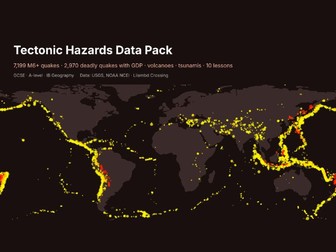
Real hazard data your students can sort, graph and test, with no internet searching needed. Every M6+ earthquake 1975-2025 (7,199 rows: date, depth, magnitude, place) 2,970 significant earthquakes since 1950, with deaths, houses destroyed and the country’s GDP per capita and income band, for “effects by level of development” questions 530 volcanic eruptions (VEI, deaths) and 1,664 tsunamis since 1900 10 ready tasks with worked answers: plate-boundary patterns, depth, trends, mean vs median, Spearman’s rank, case-study pairing Maps: M6+ quakes by depth on a world map, deaths by income band, blank grid Data: USGS ComCat and NOAA NCEI/WDS hazard databases (US Government, public); World Bank GDP (CC BY 4.0); UN WPP (CC BY 3.0 IGO); Natural Earth (public domain). Licence: use with your own classes; please do not resell. Built with our own code from public data; the lesson tasks were drafted with AI help and every answer was computed from the data. Custom data packs, maps or worksheets for your class: hello@lilambd.com
World Weather Large Data Set: 60 Cities + 12 Statistics Lessons with AnswersQuick View
LilambdCrossing

World Weather Large Data Set: 60 Cities + 12 Statistics Lessons with Answers

(0)
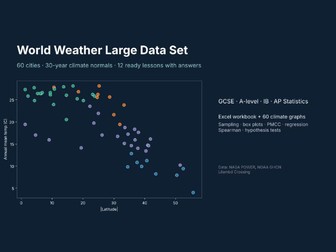
A real-world large data set for statistics lessons, built from 30-year climate normals (1991-2020) for 60 cities on every continent. Excel workbook: Cities (22 variables per city: latitude, Koppen class, temperature, rainfall, humidity, sunshine, frost days, warming trend, records), Monthly (60 cities x 12 months), 12 ready tasks, worked answers, sources. 60 climate graphs (PNG), one per city. Covers sampling, averages, quartiles and outliers, box plots, scatter and PMCC, regression, Spearman’s rank, and a hypothesis test on warming rates. Works for GCSE, A-level, IB and AP Statistics, and for geography climate units. Data: NASA POWER (public), NOAA GHCN-Daily (public), Natural Earth (public domain). City names and coordinates © OpenStreetMap contributors, Overture Maps Foundation (ODbL). Licence: use with your own classes; please do not resell. Built with our own code from public data; the lesson tasks were drafted with AI help and every answer was computed from the data. Custom data packs, maps or worksheets for your class: hello@lilambd.com
FREE SAMPLE - World Energy & Electricity Data Pack (12 countries, 3 lessons)Quick View
LilambdCrossing

FREE SAMPLE - World Energy & Electricity Data Pack (12 countries, 3 lessons)

(0)
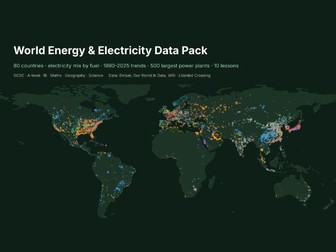
Free sample of the full World Energy & Electricity Data Pack (in my Tes shop): 12 of the 80 countries, the World time series and 3 of the 10 tasks. Try it with your class before you buy. Real electricity data for maths, geography and science lessons. Countries: 80 countries in 2024, electricity mix by fuel (coal, gas, oil, nuclear, hydro, wind, solar, bioenergy), renewables and fossil share, carbon intensity, electricity per person, GDP per person TimeSeries: World plus 15 countries, 1990-2025 (renewables, fossil, solar, wind, carbon intensity) PowerPlants: the 500 largest power plants with fuel, capacity, opening year and location 10 ready tasks with worked answers: pie charts, mean vs median, quartiles, Spearman’s rank, PMCC, percentage growth, line graphs, mapping, data-based debate Charts: world map of the largest plants, renewables trend, carbon vs renewables Data: Ember and Our World in Data (CC BY 4.0), WRI Global Power Plant Database (CC BY 4.0), World Bank (CC BY 4.0), UN WPP (CC BY 3.0 IGO), Natural Earth (public domain). Licence: use with your own classes; please do not resell. Built with our own code from public data; the lesson tasks were drafted with AI help and every answer was computed from the data. Custom data packs, maps or worksheets for your class: hello@lilambd.com
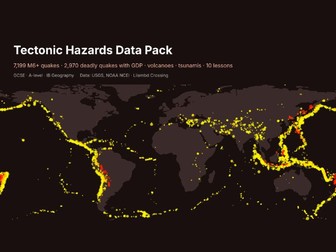
FREE SAMPLE - Tectonic Hazards Data Pack (earthquakes, volcanoes)Quick View
LilambdCrossing

FREE SAMPLE - Tectonic Hazards Data Pack (earthquakes, volcanoes)

(0)
Free sample of the full pack “Tectonic Hazards Data Pack” (search LilambdCrossing on Tes). Try a few tasks and the data with your class before you buy. Real hazard data your students can sort, graph and test, with no internet searching needed. Every M6+ earthquake 1975-2025 (7,199 rows: date, depth, magnitude, place) 2,970 significant earthquakes since 1950, with deaths, houses destroyed and the country’s GDP per capita and income band, for “effects by level of development” questions 530 volcanic eruptions (VEI, deaths) and 1,664 tsunamis since 1900 10 ready tasks with worked answers: plate-boundary patterns, depth, trends, mean vs median, Spearman’s rank, case-study pairing Maps: M6+ quakes by depth on a world map, deaths by income band, blank grid Data: USGS ComCat and NOAA NCEI/WDS hazard databases (US Government, public); World Bank GDP (CC BY 4.0); UN WPP (CC BY 3.0 IGO); Natural Earth (public domain). Licence: use with your own classes; please do not resell. Built with our own code from public data; the lesson tasks were drafted with AI help and every answer was computed from the data. Custom data packs, maps or worksheets for your class: hello@lilambd.com
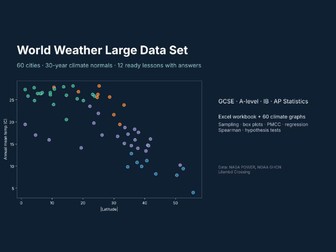
FREE SAMPLE - World Weather Large Data Set (climate statistics)Quick View
LilambdCrossing

FREE SAMPLE - World Weather Large Data Set (climate statistics)

(0)
Free sample of the full pack “World Weather Large Data Set” (search LilambdCrossing on Tes). Try a few tasks and the data with your class before you buy. A real-world large data set for statistics lessons, built from 30-year climate normals (1991-2020) for 60 cities on every continent. Excel workbook: Cities (22 variables per city: latitude, Koppen class, temperature, rainfall, humidity, sunshine, frost days, warming trend, records), Monthly (60 cities x 12 months), 12 ready tasks, worked answers, sources. 60 climate graphs (PNG), one per city. Covers sampling, averages, quartiles and outliers, box plots, scatter and PMCC, regression, Spearman’s rank, and a hypothesis test on warming rates. Works for GCSE, A-level, IB and AP Statistics, and for geography climate units. Data: NASA POWER (public), NOAA GHCN-Daily (public), Natural Earth (public domain). City names and coordinates © OpenStreetMap contributors, Overture Maps Foundation (ODbL). Licence: use with your own classes; please do not resell. Built with our own code from public data; the lesson tasks were drafted with AI help and every answer was computed from the data. Custom data packs, maps or worksheets for your class: hello@lilambd.com