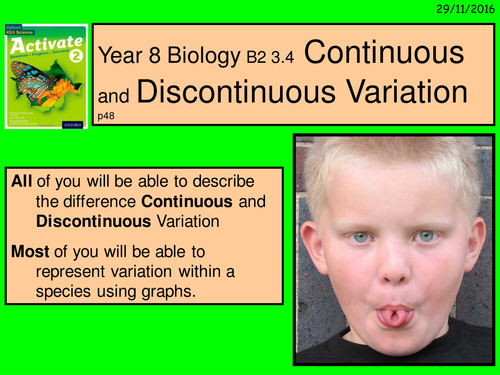
This lesson was written for middle/top sets. The lesson is designed to provoke discussion and thought about Continuous and Discontinuous variation in humans.
The main focus is on two small practicals that demonstrate both Continuous and Discontinuous traits but also the resultant Continuous (line) and Discontinuous (bar) graphs drawn from the data. This is a deliberate attempt to help students understand when it is appropriate to draw a line graph and when to draw a bar graph.
The tongue rolling practical is fast, fun and interesting.
The "measuring pupils height" practical requires meter rulers but a blank results table on slide 7 can be used to project onto the whiteboard ready for the students data,
The narrative is loose and visual so the lesson can follow the students questions but the slide sequence ensures that the learning objectives will be covered.
At the end, if you have time, there are 'book-work' references (to consolidate the learning).
An excellent resource for Science teachers who want a colourful engaging lesson written by a science teacher with over 20 years’ experience of working in a range of Schools and was awarded a Master’s Degree in 2008 in “Education and technology in Science” by Bristol University.
This lesson (and the scheme of work it is part of) has been successfully trialed in a state Academy and has been used (and improved each time) over three different classes.
Get this resource as part of a bundle and save up to 58%
A bundle is a package of resources grouped together to teach a particular topic, or a series of lessons, in one place.
Something went wrong, please try again later.
This resource hasn't been reviewed yet
To ensure quality for our reviews, only customers who have purchased this resource can review it
Report this resourceto let us know if it violates our terms and conditions.
Our customer service team will review your report and will be in touch.
£3.00
