

Exactly as the title says.
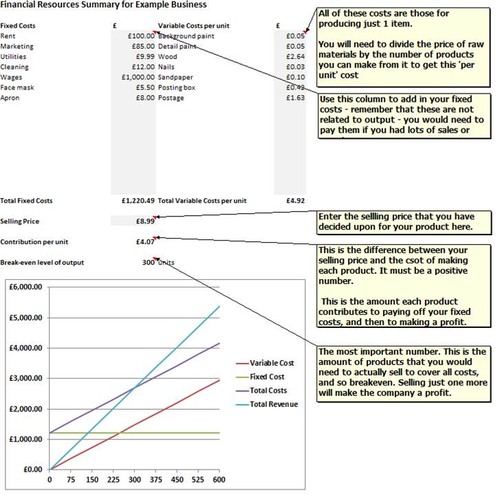
This simple Excel spreadsheet allows a student to plug in some fixed costs, variable costs and a selling price to see what the breakeven level of output would be.
Use it as a demonstration to show what happens in real time if costs / revenues change, or as a tool to support students in analysing break even where performing the calcualations is not necessary.
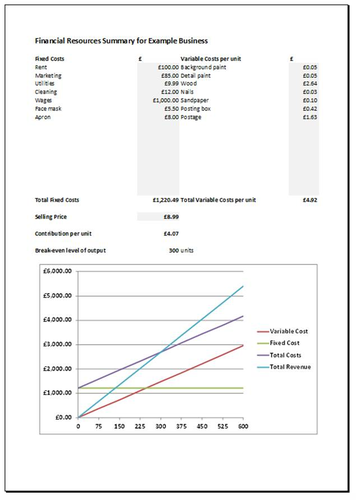
The first tab is an example (as seen in the image) with explanations/instructions that teachers/students can refer to. The second tab is a fill-in sheet to build your own!
Oh, the example tab (as per the image) is locked to try to stop students accidentally breaking it - but there is no password!
This simple Excel spreadsheet allows a student to plug in some fixed costs, variable costs and a selling price to see what the breakeven level of output would be.
Use it as a demonstration to show what happens in real time if costs / revenues change, or as a tool to support students in analysing break even where performing the calcualations is not necessary.
The first tab is an example (as seen in the image) with explanations/instructions that teachers/students can refer to. The second tab is a fill-in sheet to build your own!
Oh, the example tab (as per the image) is locked to try to stop students accidentally breaking it - but there is no password!
Something went wrong, please try again later.
This resource hasn't been reviewed yet
To ensure quality for our reviews, only customers who have downloaded this resource can review it
Report this resourceto let us know if it violates our terms and conditions.
Our customer service team will review your report and will be in touch.
£0.00