
ALevel Biology Logarithms, Logs, lesson, Populations and Sustainability, log graphs and calculations
This is an excellent resource that can be used with year 13 students studying Alevel Biology.
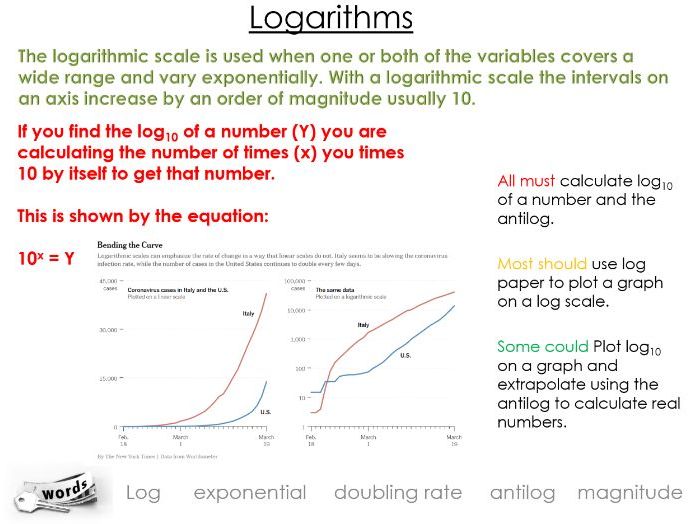
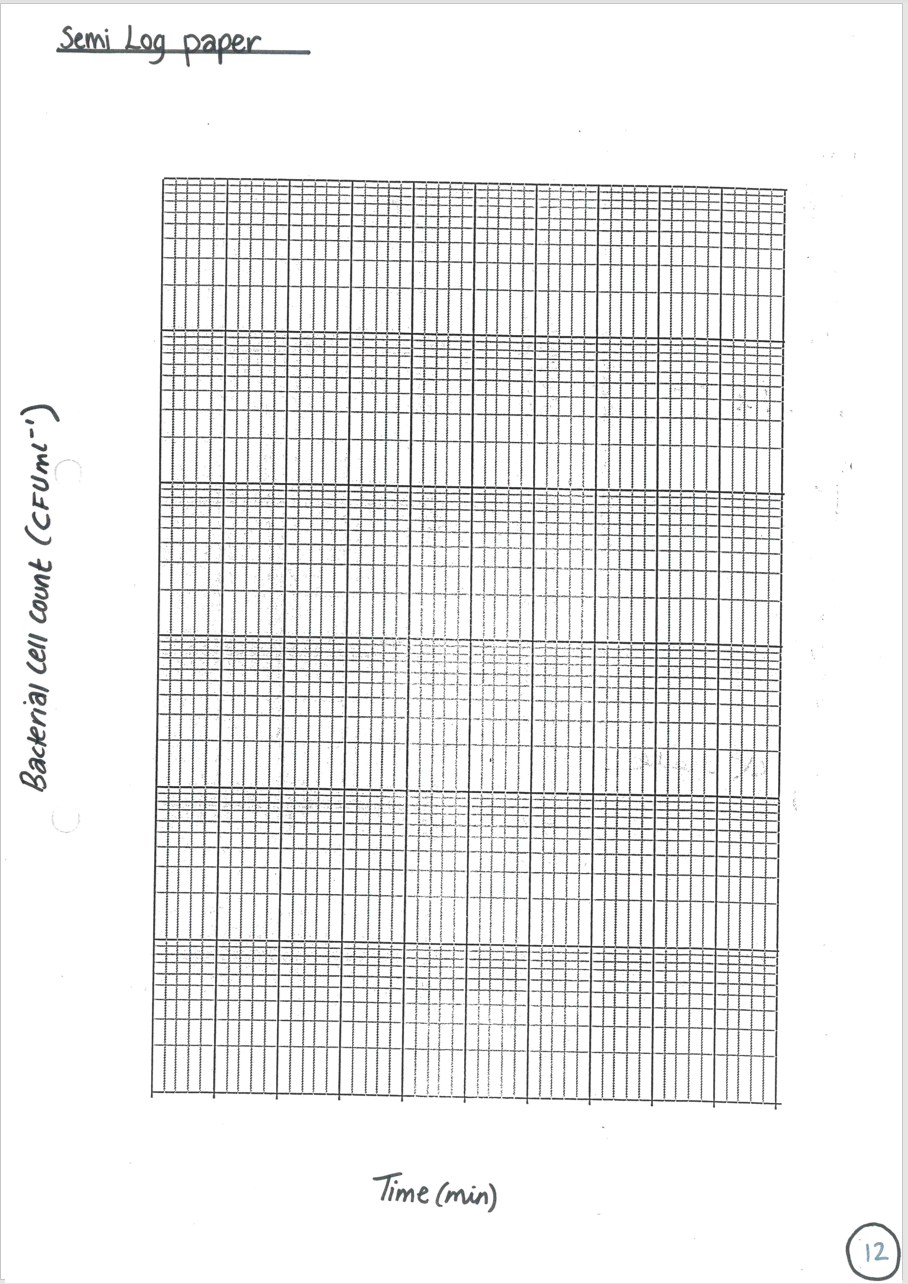
The powerpoint is designed to be visually appealing, engaging and clear. Students use the scaffolded worksheets to plot 3 different graphs, an exponential graph, a semi log graph and a linear log graph. There are also come log calculation questions which fit with the kind of questions seen in the OCR specification.
This is part of the Populations and Sustainability topic and Maths skills.
Pack includes powerpoint, worksheets x3 and model answers.
Something went wrong, please try again later.
Not enough examples of how log graphs are used in biology. The reason for log graphs given is "the graph would look rubbish", not the sort of language I would use with my class. I won't be using this in my lessons
Report this resourceto let us know if it violates our terms and conditions.
Our customer service team will review your report and will be in touch.
£4.75